


Micron vs. SanDisk: Which Memory Stock Is Better Suited for Long-Term Holding, MU or SNDK?



AI Podcast


Micron and SanDisk both benefit from AI data center expansion but feature distinct business structures. Micron’s diversified portfolio across HBM, DRAM, and NAND offers broader AI exposure and greater long-term stability. Conversely, SanDisk focuses heavily on NAND, providing higher profit elasticity during upcycles but increased vulnerability to price volatility. While SanDisk boasts lower on-balance-sheet debt, it carries joint-venture obligations through Flash Ventures. Micron’s scale and product mix make it preferable for long-term holding, whereas SanDisk suits investors seeking cyclical NAND exposure. Key monitoring areas include memory pricing, capital expenditures, inventory levels, and data center demand.
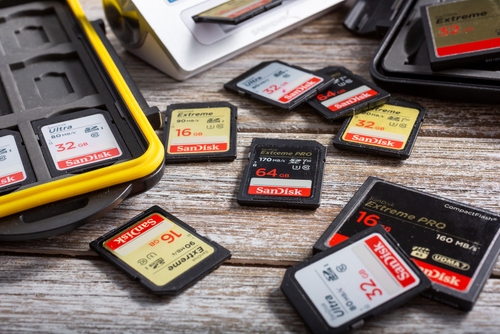
TradingKey - Micron Technology (MU) and SanDisk (SNDK) both benefit from AI data center expansion, but have different business structures. Micron covers HBM, DRAM, and NAND, enabling it to simultaneously supply products for AI accelerators, server main memory, and data center storage; SanDisk primarily focuses on NAND flash memory and related storage products, covering enterprise SSDs, client SSDs, and consumer storage devices.
Compared to Micron, SanDisk's product structure is more concentrated on NAND, making its performance more sensitive to flash memory prices, product mix, and demand for data center and client storage.
What Is the Difference Between Micron and SanDisk?
Comparison Item | Micron (MU) | SanDisk (SNDK) |
Core Products | HBM, DRAM, NAND | NAND, enterprise and consumer SSDs |
AI Beneficiary Focus | AI accelerator memory, server memory and storage | AI data center SSDs |
Key Risks | High capital expenditures, memory price declines | NAND business concentration, inventory and supply partnership risks |
Micron has a broader product range, avoiding complete reliance on a single memory category; SanDisk's business is more concentrated, offering greater profit elasticity when NAND prices rise, while earnings may contract faster when prices fall.
Micron Is More Profitable, SanDisk Has Lower Book Debt
Micron Technology's revenue for the third quarter of fiscal 2026 reached $41.456 billion, up about 346% year-over-year, with a GAAP gross margin of 84.6% and net income of $28.243 billion. Impacted by an increase in accounts receivable, operating cash flow for the quarter was $25.390 billion, lower than net income.
Micron expects fourth-quarter revenue to be between $49 billion and $51 billion. HBM4 has begun mass shipments to major customers' platforms, with HBM and high-end DRAM improving the product mix. Whether the gross margin of 84.6% can be sustained still depends on memory prices, supply-demand dynamics, and product mix.
SanDisk's revenue for fiscal year 2026 was $20.248 billion, up 175% year-over-year; net income reached $11.433 billion, compared to a net loss of $1.641 billion in the prior-year period; operating cash flow was $11.671 billion. SanDisk's figures are on a full-year basis and cannot be directly compared to Micron's single-quarter performance.
SanDisk's data center revenue surged 437% year-over-year to $5.153 billion, driven primarily by concurrent increases in shipment volumes and selling prices per GB. Because its business is concentrated in NAND, a decline in flash memory prices would directly impact its revenue and gross margin.
At the end of the third fiscal quarter, Micron held a total of $30.2 billion in cash, marketable investments, and restricted cash, while current and long-term debt totaled $5.722 billion. Net capital expenditures for the quarter were $7.1 billion, and accounts receivable rose to $31.025 billion.
SanDisk held $4.762 billion in cash at the end of the fiscal year, fully paid off its term loans, and had no outstanding borrowings under its revolving credit facility; inventory increased to $2.698 billion from $2.079 billion at the end of the previous year.
SanDisk reported expenditures for property, plant, and equipment of $177 million in fiscal year 2026, but it primarily obtains its NAND wafer supply through Flash Ventures, a joint venture operated with Kioxia. SanDisk holds a 49.9% interest in the joint venture, assuming about half of the fixed costs, roughly 49.9% to 50% of capital contributions when cash flow is insufficient, and certain equipment lease guarantees.
Therefore, SanDisk's balance-sheet interest-bearing debt is lower than Micron's; however, evaluating its financial pressure requires accounting for its capital contribution, procurement, and guarantee obligations related to Flash Ventures.
MU vs. SNDK: Which Is Better for Long-Term Holding?
As of the close on September 18, 2026, according to StockAnalysis data, the TTM P/E ratios of Micron and SanDisk were 22.9x and 24.3x, respectively, and their forward P/E ratios were 7.0x and 8.4x, respectively.
The forward valuations of both companies are built on the foundation of substantial growth in memory chip prices and earnings. Should industry supply and demand weaken, earnings forecasts and valuation levels may be adjusted accordingly.
Micron covers HBM, DRAM, and NAND, with growth sources including AI accelerator memory, server main memory, and data center storage. SanDisk's business is concentrated in NAND, enterprise SSDs, and other flash memory products, and its operational performance is more sensitive to NAND prices and data center storage demand.
SanDisk's on-balance-sheet debt and debt-to-equity ratio are lower than Micron's, but the company also needs to bear fixed costs, capital expenditures, and equipment lease guarantees related to Flash Ventures. Micron's capital expenditure scale is larger, and its accounts receivable have also risen significantly alongside revenue growth.
Considering product mix, AI demand coverage, and current valuations, Micron is more suitable as a long-term holding target; investors who are optimistic about the continued rise in NAND prices and enterprise SSD demand and can tolerate stronger cyclical volatility may pay attention to SanDisk. Moving forward, key areas to observe include changes in memory prices, capital expenditures, inventories, accounts receivable, and data center orders.
This content was translated using AI and reviewed for clarity. It is for informational purposes only.
Recommended Articles









Comments (0)
Click the $ button, enter the symbol, and select to link a stock, ETF, or other ticker.