


Crude Oil Price Forecast: Can Brent Hold $100 as Saudi Export Recovery Weighs on Risk Premium?



AI Podcast


International oil prices declined for a fourth consecutive session, with Brent falling to $101.97 per barrel and WTI to $94.18, driven by recovering Saudi crude exports and potential U.S.-Iran diplomatic breakthroughs that reduced geopolitical risk premiums. Saudi Arabia successfully mitigated East-West pipeline disruptions by rerouting shipments through the Strait of Hormuz. Technically, Brent’s short-term upside momentum has weakened, breaking below the 23.6% Fibonacci retracement. However, prices remain above key moving averages. The $100 psychological level serves as critical short-term support; holding this threshold could trigger a rebound, while a decisive break lower risks deeper corrections toward $97.87 and below.

TradingKey - International oil prices fell for a fourth consecutive trading day on Monday, marking their longest losing streak since June. Although Iranian-backed Houthi militants launched fresh attacks on Saudi targets, a rebound in Saudi crude exports and market expectations for a diplomatic breakthrough between the U.S. and Iran temporarily outweighed supply concerns raised by geopolitical conflict.
As of writing, Brent crude futures (UKOIL-F) fell to $101.97 per barrel, while WTI crude futures (USOIL-F) stood at $94.18.
Why Are Crude Oil Prices Falling?
The direct cause of the recent pull-back in oil prices is that Saudi Arabia mitigated the impact of the East-West pipeline shutdown on actual supply by adjusting shipping routes.
Houthi militants previously attacked the East-West pipeline connecting Saudi Arabia's eastern oil fields to the Red Sea port of Yanbu, forcing Saudi Aramco to suspend some exports via Yanbu. Since then, Saudi Arabia has increased crude shipments through the Strait of Hormuz to offset the export shortfall in the Red Sea direction.
Preliminary data from Kpler show that Saudi crude exports since September have recovered to more than 4 million barrels per day, significantly higher than 2.4 million barrels per day in August. Shipping data also show that over the past six days, Saudi crude shipments through the Strait of Hormuz averaged about 2.9 million barrels per day, compared with just 700,000 barrels per day in August.
JPMorgan noted in a report on September 18 that despite the disruption to the East-West pipeline, Middle East oil transit remains more resilient than the market had previously feared. Over the past 10 days, average daily crude flows from the region were around 17.1 million barrels per day, which, although still 6.1 million barrels per day below the 2025 average level, did not result in large-scale supply disruptions.
Meanwhile, Saudi Arabia expects the East-West pipeline to restore about half of its capacity within days, further easing market concerns over prolonged supply disruptions. As alternative shipping routes came into play, traders began cutting the geopolitical risk premium previously priced into oil.
The potential resumption of diplomatic contacts between the US and Iran is another reason weighing on oil prices. Qatari Foreign Ministry spokesman Majed al-Ansari said on September 20 that Qatar is maintaining communication with both the US and Iran in an effort to push both sides back to the negotiating table. Information Qatar received from US officials indicates that the US side wants to reach a deal and is seeking a solution to end the conflict.
Iran has also submitted conditions for resuming negotiations through mediators. Although US President Trump stated he remains in a "decision-making phase" regarding Iran and warned that the situation could change dramatically soon, he did not rule out the possibility of meeting with Iranian President Pezeshkian. As the UN General Assembly convenes, the market has begun betting that both sides might send new diplomatic signals.
Crude Oil Price Technical Analysis: Can Brent Hold $100?
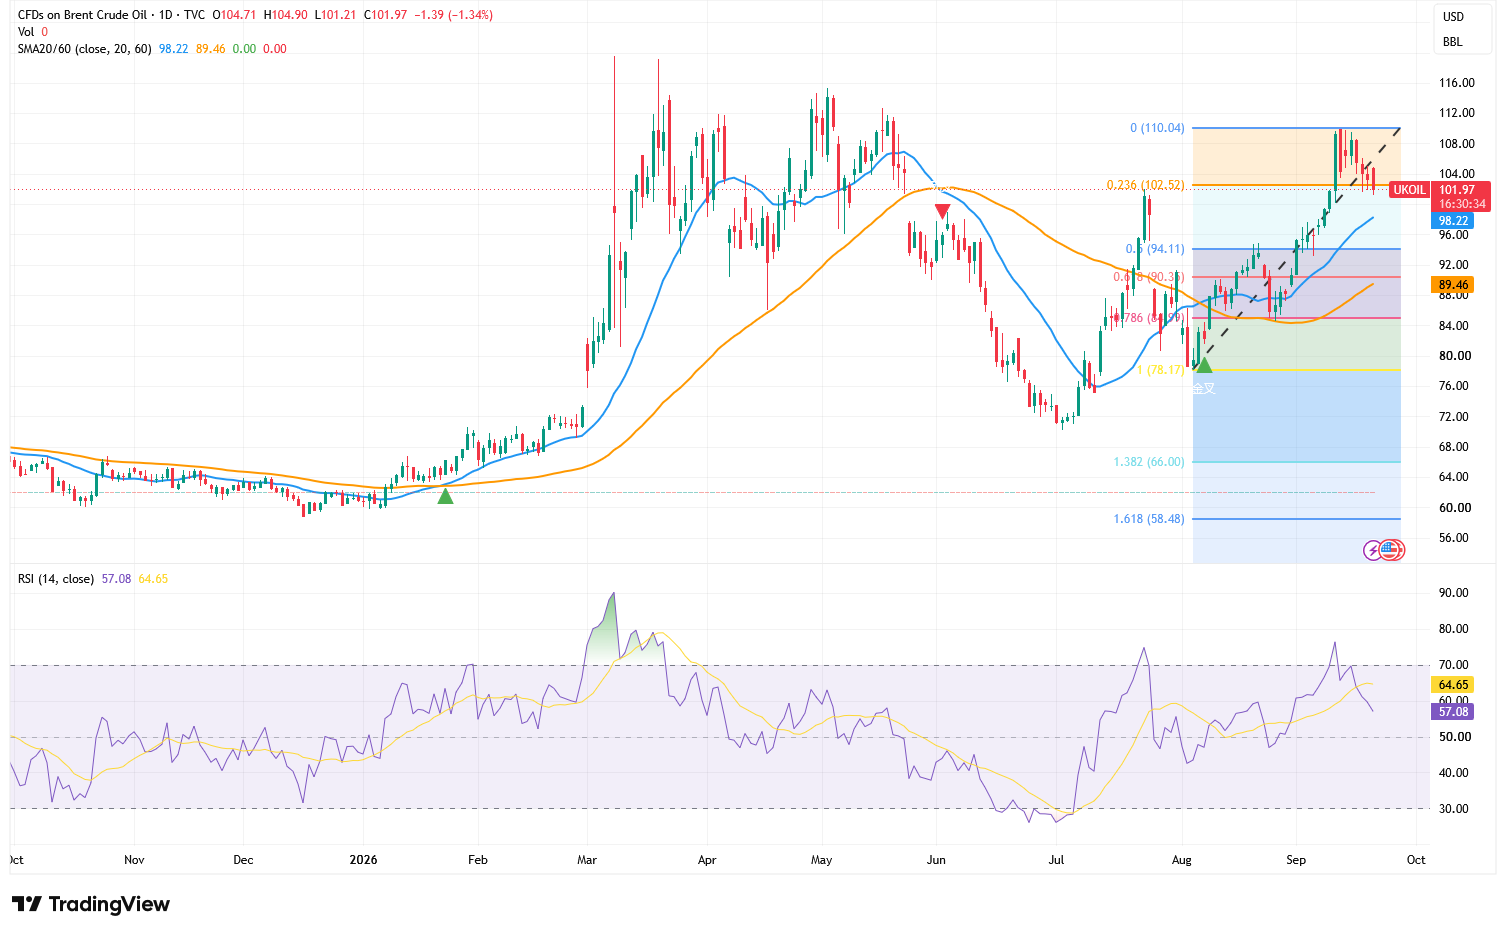
Source: TradingView
On the daily chart, Brent crude has pulled back continuously after touching $110.04 and was last trading at $101.97. It has temporarily broken below the 23.6% Fibonacci retracement level of $102.52 as well as the previous accelerated uptrend line, indicating that short-term upside momentum has weakened significantly.
The RSI has dropped from the overbought territory to 57.08 and fallen below its signal line at 64.65, reflecting cooling bullish momentum. However, the RSI remains above 50, and oil prices continue to trade above the 20-day moving average of $98.22 and the 60-day moving average of $89.46. Therefore, the current price action is closer to a technical correction after a rally, and the medium-term trend has not fully weakened.
In the short term, the first level to watch is the $100 psychological mark. If oil prices can hold above $100 and reclaim $102.52, there remains an opportunity to rebound toward $105 and test $110.04 again.
Conversely, if the daily close falls below $100, oil prices could further pull back to test the $97.87–$98.22 support zone. If this area gives way, the next downside levels to watch in sequence will be $94.11 and $90.35.
This content was translated using AI and reviewed for clarity. It is for informational purposes only.
Recommended Articles











Comments (0)
Click the $ button, enter the symbol, and select to link a stock, ETF, or other ticker.