


Gold Price Forecast: Stronger-Than-Expected Payrolls Weigh on Gold as Market Eyes August CPI; Can Gold Still Rally?



AI Podcast


During the Asian session on September 9, gold prices rebounded modestly to trade near $4,370, down from last week's high of $4,510. Stronger-than-expected August U.S. employment data and elevated Treasury yields have heightened expectations for a Federal Reserve rate hike, pressuring non-yielding gold. Investors now await upcoming PPI and CPI figures to gauge future inflation and rate trajectories. Technically, gold remains under bearish pressure, with the RSI below 50 and a death cross on the moving averages. Key support stands at $4,300, while primary resistance is watched at $4,390–$4,400.
TradingKey - As of the Asian session on September 9, gold prices (XAUUSD) maintained a modest intraday rebound, rising about 0.36% on the day to trade near $4,370, pulling back significantly from last week's high of $4,510. Following stronger-than-expected US August employment data, expectations for a Fed rate hike in September increased, while international oil prices neared $100. Investors are awaiting this week's US PPI and CPI data to further confirm the direction of gold prices.
Nonfarm Payrolls Reinforce Employment Resilience as Inflation Data Becomes Key Driver for Gold
From a fundamental perspective, the core factor weighing on gold prices recently has been the rising expectations of a Federal Reserve rate hike.
U.S. nonfarm payrolls for August, released last week, increased by 162,000, significantly higher than the previous market expectation of around 56,000, while the unemployment rate remained at 4.1%. Following the release of the employment report, the interest rate futures market's pricing for a 25-basis-point Fed rate hike in September rose from about 50% prior to the data to around 60%.
Meanwhile, U.S. Treasury yields remained at elevated levels. On September 8, the 10-year U.S. Treasury yield was around 4.8%, close to its highest level since November 2023. For non-yielding gold, elevated real and nominal bond yields typically raise its holding cost relative to bond assets.
Energy prices, meanwhile, have added uncertainty to this week's inflation data. Driven by the Middle East situation and supply disruptions, Brent crude (UKOIL) prices approached $100, while WTI crude (USOIL) prices approached $95. Shifts in energy prices gradually feed into gasoline, transportation, and certain production costs, but uncertainty remains regarding the extent and timing of their ultimate pass-through to U.S. core inflation, so it cannot be simply equated to a guaranteed sharp resurgence in inflation.
For investors, the key focus will be on the August PPI and CPI to be released this Thursday and Friday. Looking at market expectations, headline PPI in August is expected to rise 0.4% month-over-month, significantly higher than July's 0.0%; core PPI is expected to rise 0.3% month-over-month, also above July's 0.2%; August headline CPI is expected to rise 0.4% month-over-month, higher than July's 0.1%; the year-over-year rate is expected to hold at around 3.4%; core CPI is expected to rise 0.2% month-over-month, flat from July, while year-over-year core CPI is expected to slow further from 2.5% to 2.4%.
For gold, if PPI and CPI come in higher than market expectations, the probability of a September Fed rate hike may rise further, U.S. Treasury yields could remain high, and gold prices may remain under pressure and continue to move lower. If PPI and CPI come in below expectations, it could reduce market expectations for a September rate hike and pull U.S. Treasury yields back down, thereby supporting gold prices.
Gold Price Technical Analysis
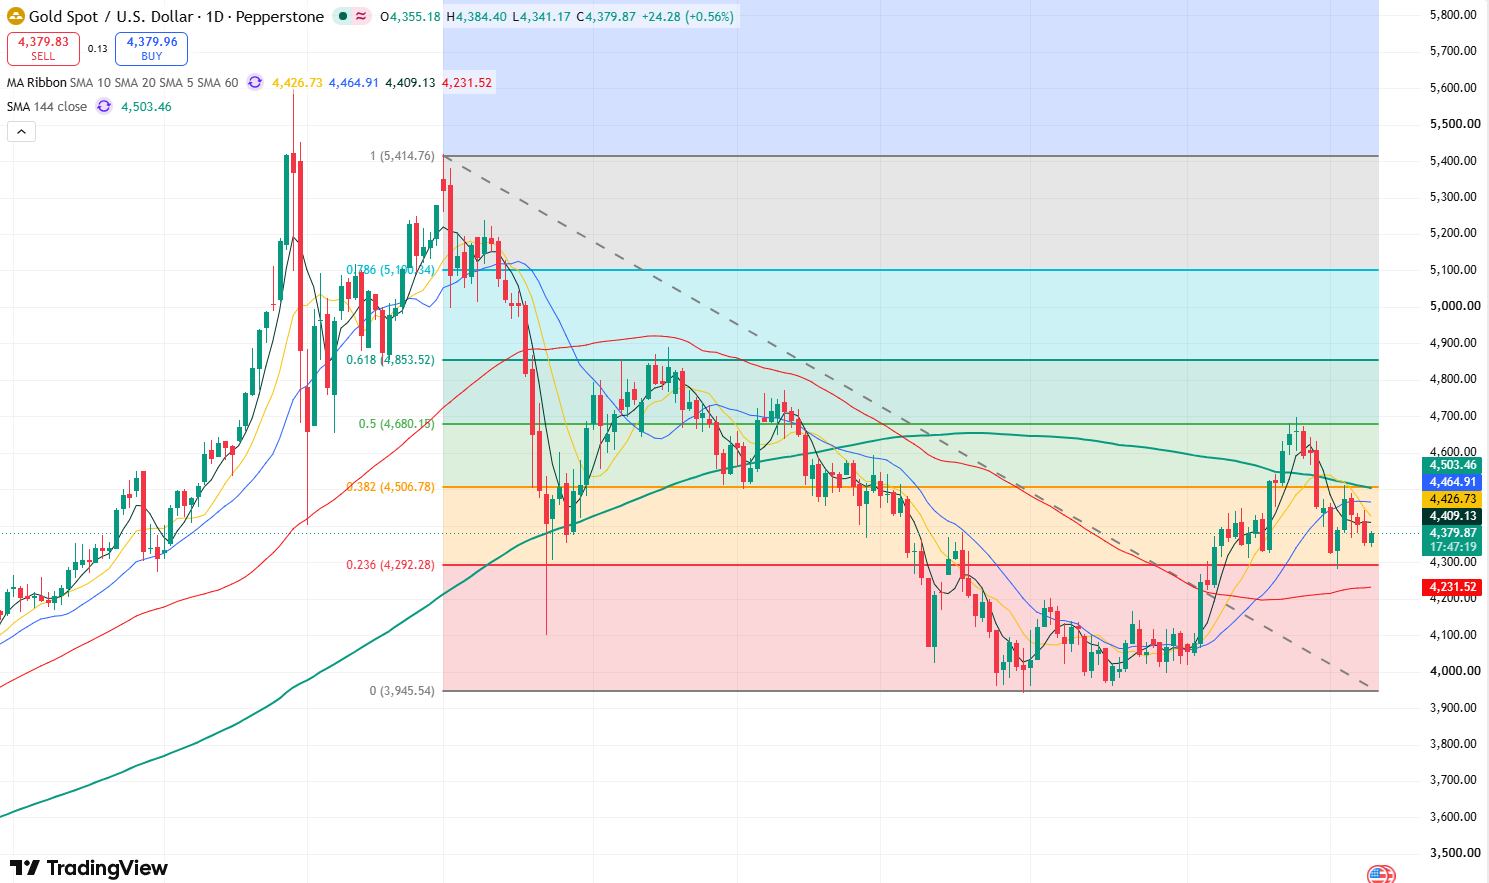
Gold Price Daily Chart, Source: TradingView
Looking at the daily chart, gold prices have pulled back from last week's high of $4,510, with the potential to test the $4,300 level again. However, gold rebounded today amid a weakening US dollar, recovering some bullish sentiment, though it remains in a tug-of-war between bulls and bears.
In terms of technical indicators, the Relative Strength Index (RSI) sits below 50, indicating that bears currently hold the upper hand and short-term downside remains possible. Meanwhile, the 10-day moving average has crossed below the 20-day moving average, forming a death cross structure that further strengthens bearish momentum.
Currently, gold prices have begun to rebound near $4,350, but the strength of the bounce is weak. In the short term, gold may continue to test the $4,300 support level on the downside.
On the downside, bulls need to focus on $4,300. If this level fails to hold, gold prices may fall further toward $4,200, and could even test the $4,000 mark.
On the upside, the primary resistance level to watch is $4,390-$4,400. If gold prices can hold above $4,400, they will further test the $4,450 resistance level, with $4,510 beyond that; a breakthrough above $4,510 will open up upside room toward $4,700.
This content was translated using AI and reviewed for clarity. It is for informational purposes only.
Recommended Articles











Comments (0)
Click the $ button, enter the symbol, and select to link a stock, ETF, or other ticker.