

Gold Price Forecast: Stronger ADP, NFP Ahead, $4,360 Support Is Key


AI Podcast
Gold prices declined due to geopolitical tensions between the U.S. and Iran, which fueled oil price surges. Strong ADP employment data suggests the U.S. labor market remains resilient, reducing the Federal Reserve's incentive to ease policy and pressuring gold. The market awaits May non-farm payroll data, with a weaker-than-expected figure potentially supporting gold, while a strong report could extend its downside. Technically, gold is testing critical support around $4,360; a break below could lead to further declines towards $4,100, while holding this level might trigger a corrective rally.

TradingKey - On June 4 ET, amid ongoing fluctuations in the U.S.-Iran situation, gold prices ( XAUUSD) have recently trended lower, and as oil prices continue to rise, downward pressure on gold has intensified. The market is currently awaiting the release of U.S. May non-farm payroll data to determine gold's short-term trajectory.
Robust ADP weighs on gold; non-farm payrolls key to market direction.
According to reports, on Wednesday Eastern Time, the U.S. struck an Iranian oil tanker attempting to break a blockade, and Iran subsequently launched missile attacks on U.S. bases in Bahrain and Kuwait. As the U.S. and Iran exchanged fire again, oil prices surged, with WTI ( USOIL) crude oil jumped 3%, reaching an intraday high of $97, while Brent crude rose as high as $98.99; gold, meanwhile, fell 1.2% to close at $4,434.29.
At the same time, rising oil prices exacerbated market concerns that energy prices could spill over into broader inflation. U.S. stocks retreated from their highs, and the three major U.S. indices ended their previous winning streaks. Some energy market analysts believe that if the Strait of Hormuz remains closed, global energy supply constraints could further heighten inflation risks.
While the situation between the U.S. and Iran put pressure on oil prices, ADP employment data released on June 3 also increased short-term pressure on gold. U.S. private payrolls added 122,000 in May, exceeding market expectations of 118,000 and the upwardly revised prior figure of 105,000, indicating that the labor market has not yet cooled significantly. Stronger employment data implies the Federal Reserve has no urgent need to pivot toward easing, especially as oil prices climb again. Markets are increasingly worried that the U.S. economy is entering a state of "sticky inflation and resilient employment." This typically supports the U.S. dollar and Treasury yields, exerting downward pressure on gold.
More importantly, market focus has shifted to the upcoming May non-farm payroll data to be released on June 5. Current market expectations are for an addition of approximately 85,000 jobs in May, with the unemployment rate holding steady at 4.3%. If the non-farm figure is significantly weaker than expected, it would suggest an accelerating cooling of the labor market, potentially causing Treasury yields to pull back and gold to gain recovery momentum. Conversely, if the data is stronger than expected—particularly if wage growth remains resilient—it will further reinforce the view that high interest rates will persist for longer, likely keeping gold under pressure.
Gold Price Technical Analysis: $4,360 Becomes Critical Make-or-Break Level for Bulls
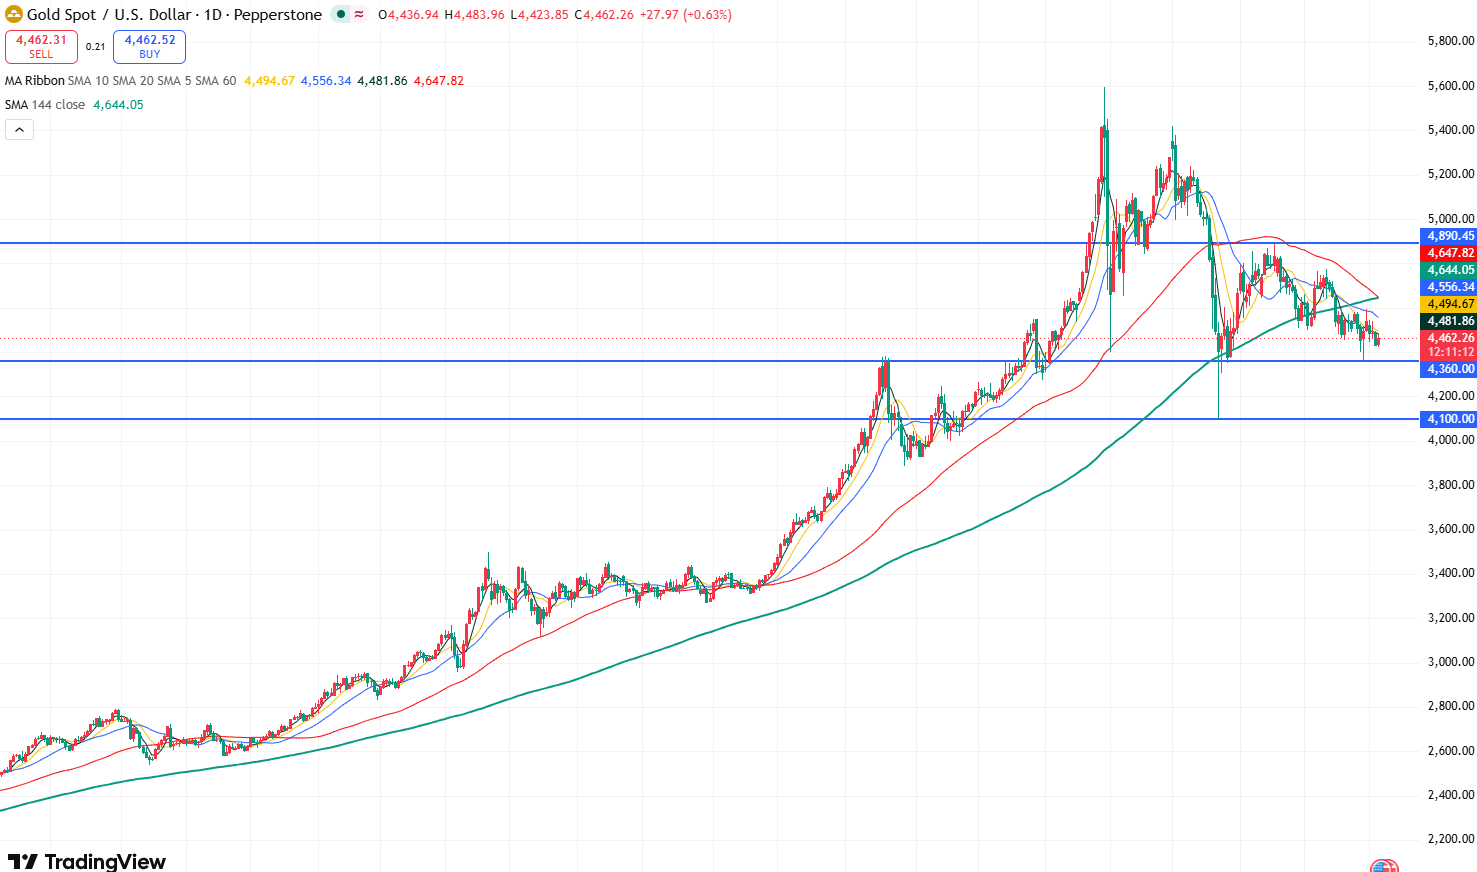
Gold price daily chart, Source: TradingView
Based on gold's daily chart, the recent trend has been in a phase of wide-range oscillation between 4890 and 4360. As the price action has gradually moved below the 144-day moving average, overall market sentiment is shifting toward a bearish outlook.
It is worth noting that while gold retraced to the key support level of $4,360 on May 28 without breaking down, price action in recent days clearly shows lower highs and lower lows, indicating weakening bullish momentum. Gold may continue to test the $4,360 support level.
Currently, if gold tests the $4,360 support level again and fails to break below it, the price may see a technical corrective rally, potentially testing the $4,890 resistance level. Conversely, if it breaks below $4,360, it will open up downside potential toward the $4,100 support level.
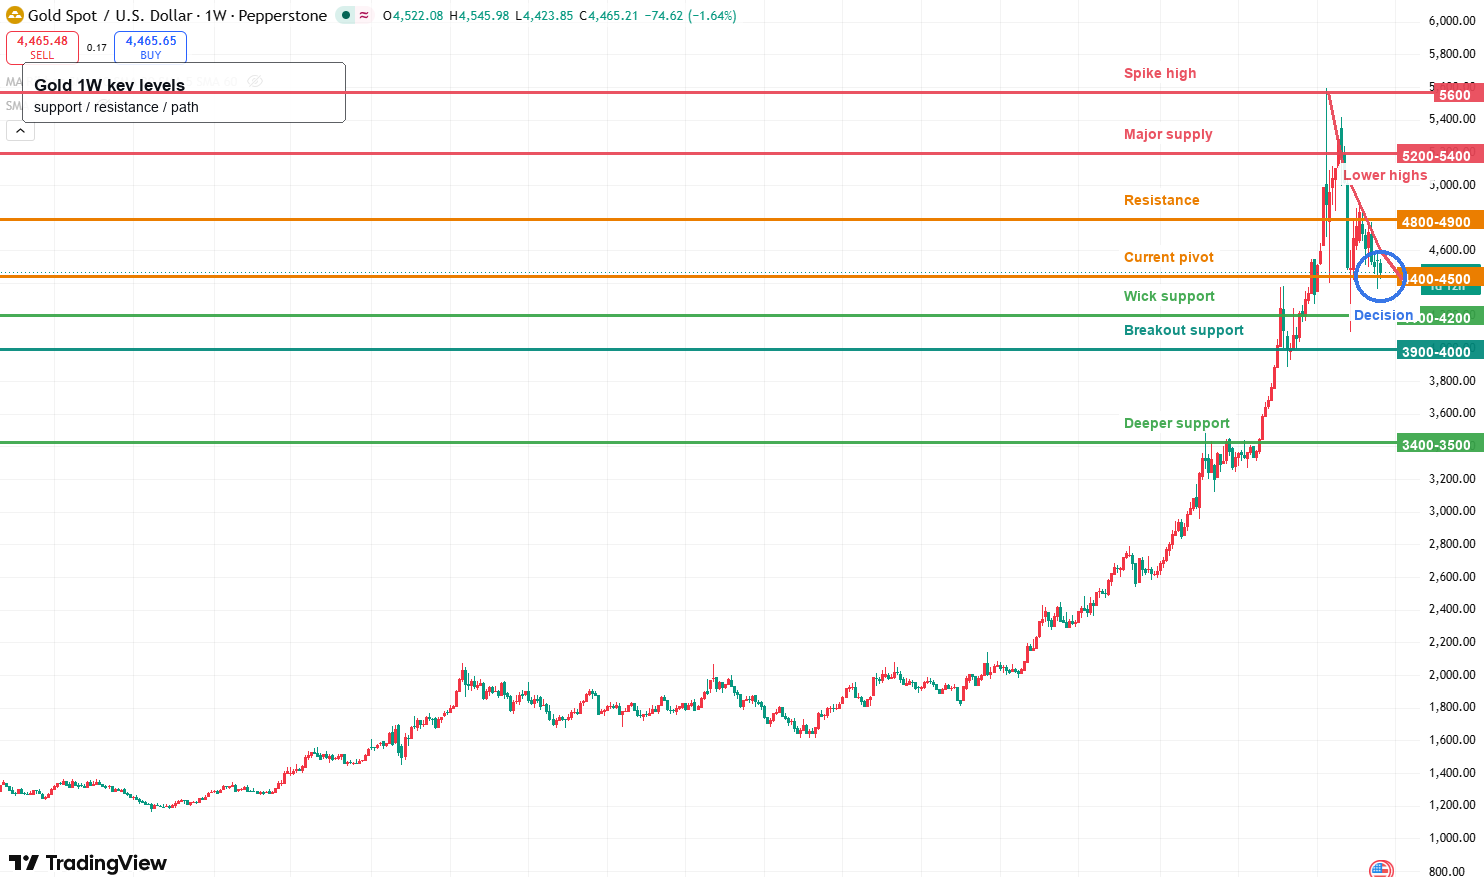
Gold price weekly chart, Source: TradingView
From gold's weekly chart, after a long-term primary uptrend, gold has entered a period of high-level wide-range volatility, peaking at $5,597.91 and currently consolidating near 4,460. Core support is around 4,400; if it holds and climbs back above 4,800-4,900, it will have the chance to retest 5,200-5,400. If 4,400 is lost, the downside targets are 4,100-4,200, followed by support at 3,900-4,000.
This content was translated using AI and reviewed for clarity. It is for informational purposes only.
Recommended Articles


Comments (3)
Click the $ button, enter the symbol, and select to link a stock, ETF, or other ticker.