

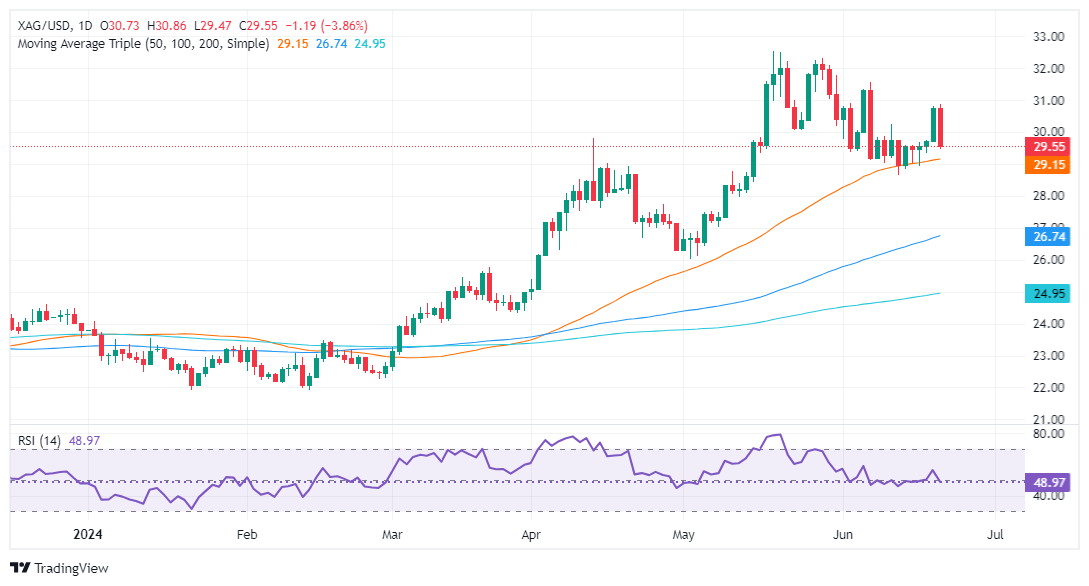
Silver Price Analysis: XAG/USD sinks below $30.00 as bearish-engulfing pattern looms


- Silver declines 3.86% sparked by firm US Treasury yields and a strong US Dollar.
- Technical outlook shows a bearish engulfing pattern with RSI turning bearish, indicating potential further losses.
- Key support levels: 50-DMA at $29.09, $29.00, and MTD low of $28.66, with deeper support at 100-DMA of $26.60.
- Key resistance levels: June 7 high at $31.54, $32.00, and YTD high of $32.51.
Silver price dropped sharply and snapped two days of gains amid firm US Treasury bond yields and a strong US Dollar. The grey metal trades at $29.53 , down 3.86%
XAG/USD Price Analysis: Technical outlook
Silver is still bullish biased though joining today and yesterday price action completed a ‘bearish engulfing,’ chart pattern. Momentum shifted in sellers’ favor as the Relative Strength Index (RSI) turned bearish and opened the door for further losses.
That said, XAG/USD's first support would be the 50-day moving average (DMA) at $29.09; it will expose $29.00. Breaching this level could lead to the MTD low of $28.66, ahead of a potential drop towards the 100-DMA at $26.60.
On the flip side, if XAG/USD resumes its uptrend, the next resistance level is the June 7 high of $31.54. Clearing this level would target $32.00 before challenging the year-to-date (YTD) high of $32.51.
XAG/USD Price Action – Daily Chart
XAG/USD
Overview | |
|---|---|
Today last price | 29.55 |
Today Daily Change | -1.18 |
Today Daily Change % | -3.84 |
Today daily open | 30.73 |
Trends | |
|---|---|
Daily SMA20 | 30.26 |
Daily SMA50 | 29.11 |
Daily SMA100 | 26.68 |
Daily SMA200 | 24.92 |
Levels | |
|---|---|
Previous Daily High | 30.79 |
Previous Daily Low | 29.71 |
Previous Weekly High | 30.26 |
Previous Weekly Low | 28.66 |
Previous Monthly High | 32.51 |
Previous Monthly Low | 26.02 |
Daily Fibonacci 38.2% | 30.38 |
Daily Fibonacci 61.8% | 30.12 |
Daily Pivot Point S1 | 30.03 |
Daily Pivot Point S2 | 29.33 |
Daily Pivot Point S3 | 28.95 |
Daily Pivot Point R1 | 31.11 |
Daily Pivot Point R2 | 31.49 |
Daily Pivot Point R3 | 32.2 |
Recommended Articles


Comments (0)
Click the $ button, enter the symbol, and select to link a stock, ETF, or other ticker.