Solana Price Forecast: SOL slides below $92 as downside risk grows



- Solana extends its correction, trading below $92 on Wednesday, down over 3.5% so far this week.
- Muted ETF demand, increasing short positions, and heating market conditions continue to cap SOL's recovery.
- Deteriorating technical outlook suggests further downside risk, keeping SOL vulnerable to a deeper correction.
Solana (SOL) remains under pressure, trading below $92 on Wednesday and declining more than 3.5% so far this week. Muted demand for US-listed spot Solana Exchange Traded Funds (ETFs), rising short positions and overheated market conditions continue to weigh on sentiment, limiting recovery attempts. Meanwhile, a deteriorating technical outlook points to further downside risks, leaving SOL vulnerable to a deeper correction.
Weakening metrics cap Solana’s recovery
Solana price dipped below $92 on Wednesday, down over 3.5% so far this week and pointing to the sixth straight week of losses since late September.
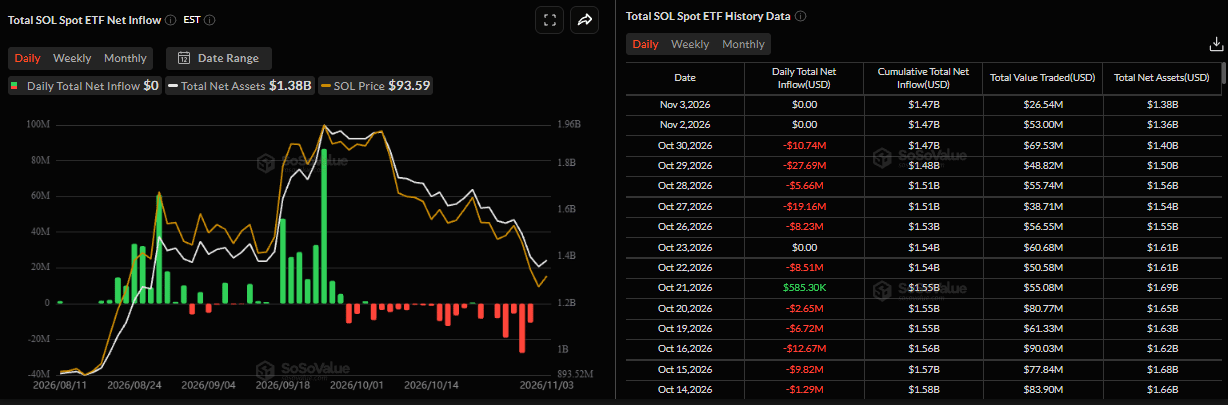
SoSoValue data shows that SOL’s spot Exchange-Traded Funds (ETFs) have remained largely silent so far this week, after recording the highest weekly withdrawals since their launch last week. This indicates a lack of meaningful institutional demand for the token. This muted demand also fails to provide a cushion against falling SOL prices.
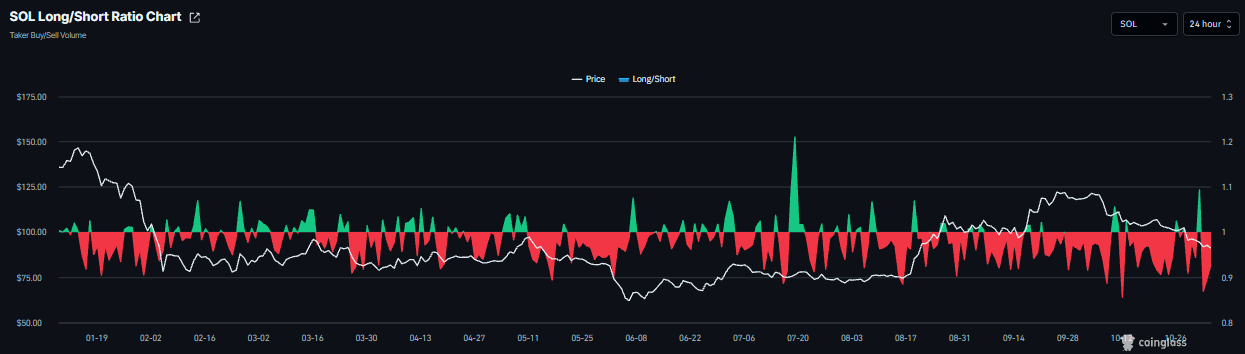
On the derivatives side, CoinGlass’ long-to-short ratios for SOL read 0.92 on Wednesday, nearing the lowest level over a month. A ratio below one indicates bearish sentiment, as traders bet that asset prices will fall.
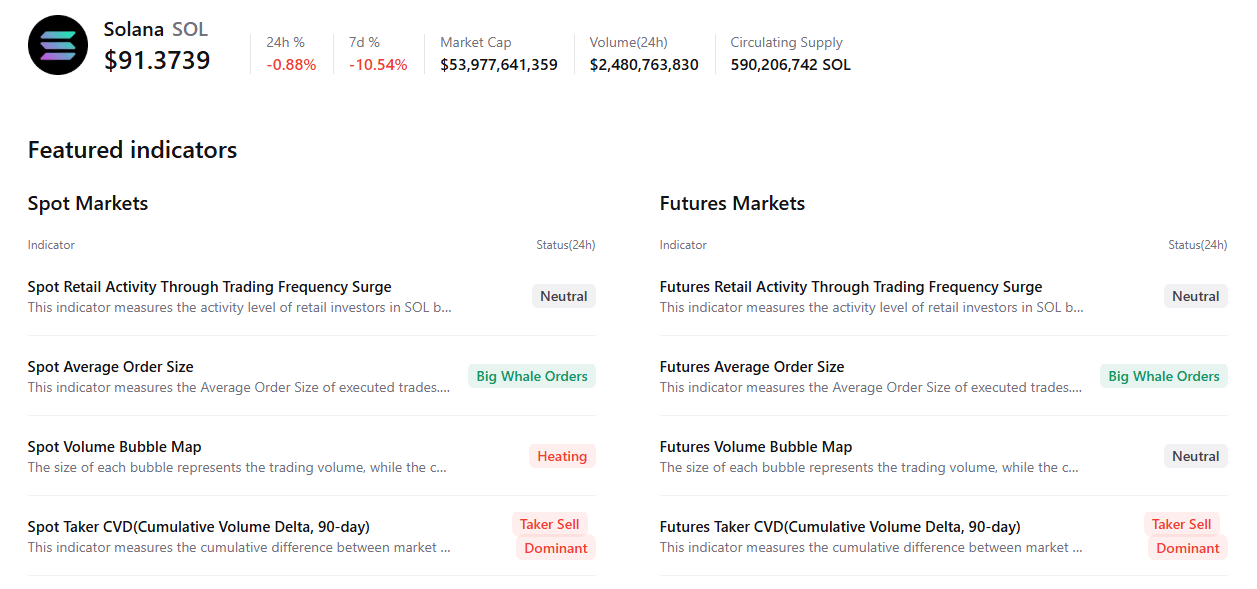
In addition, CryptoQuant’s summary data shows a cautious tone. SOL’s spot and futures markets show large whale orders alongside sell-side dominance. Spot markets also show overheating conditions. These highlight a bearish, cautious sentiment bias among Solana traders, capping its recovery.
Solana technical outlook: Fading bulls
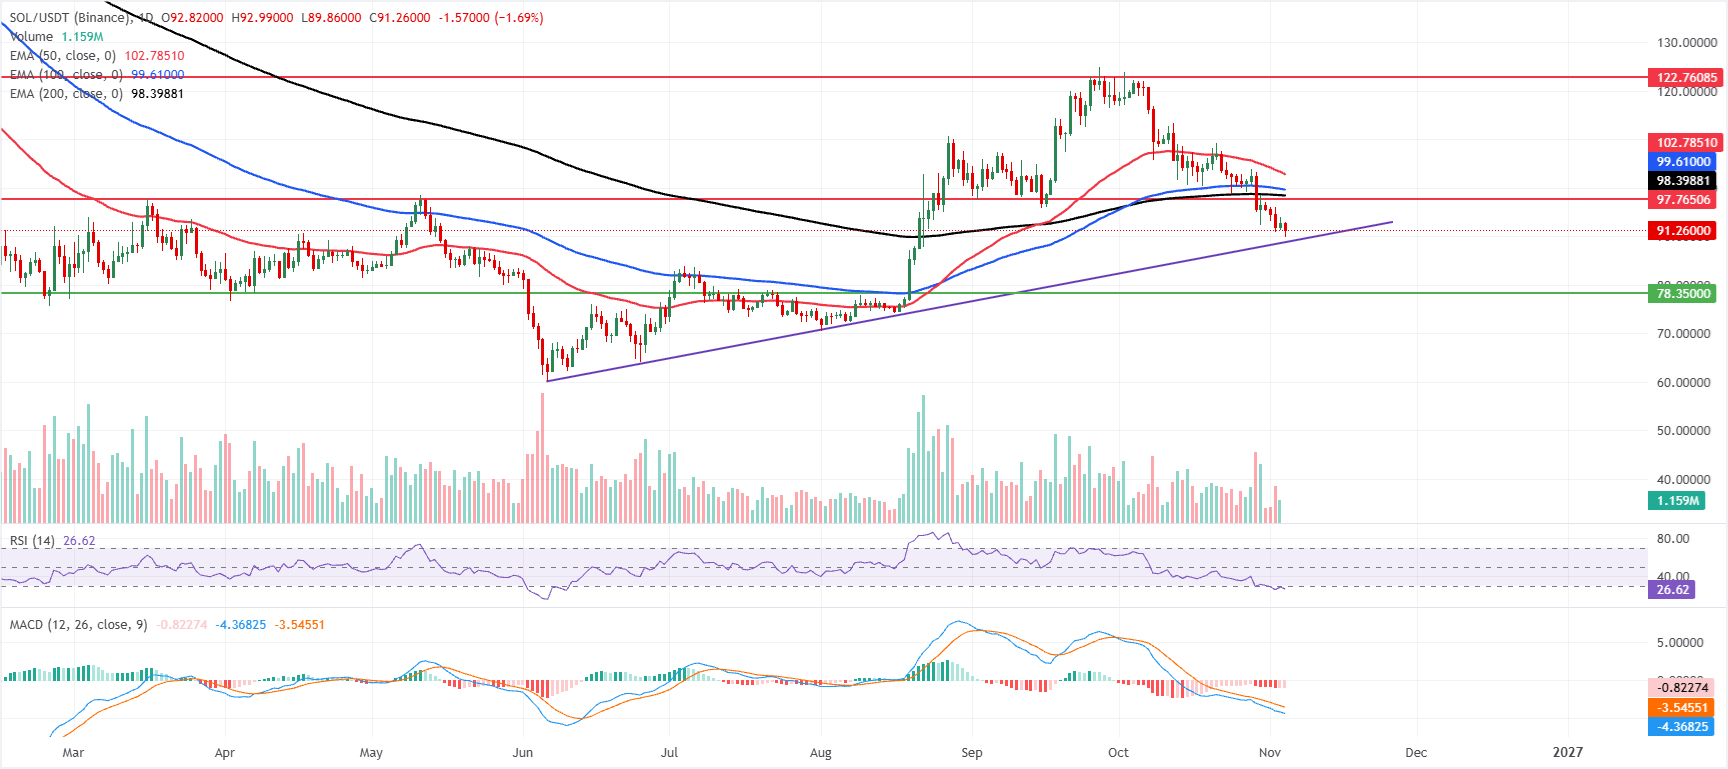
Solana price trades at $91.26 on Wednesday, maintaining a bearish near-term bias as it holds below the key Exponential Moving Averages (EMAs). The 50-day EMA at $102.78, the 100-day EMA at $99.61 and the 200-day EMA at $98.39 all act as stacked overhead resistance, suggesting the recent slide remains in force.
Momentum metrics remain weak, with the Relative Strength Index (RSI) hovering in oversold territory near 26 and the Moving Average Convergence Divergence (MACD) line entrenched below zero, reinforcing the prevailing downside pressure even as conditions start to look stretched.
On the topside, initial resistance is seen at the horizontal barrier around $97.76, followed by the 200-day EMA at $98.39 and the 100-day EMA at $99.61, while the 50-day EMA at $102.78 marks a stronger cap before the higher horizontal level at $122.76.
On the downside, the immediate reference is the current price area itself, with prior rising trendline dynamics now tracking back towards the break zone around $88.80, ahead of more substantial horizontal support near $78.35, where buyers would be expected to show stronger interest if the decline extends.
(The technical analysis of this story was written with the help of an AI tool. Know more.)