技術指標
指標
數值
方向
MACD(12,26,9)
-0.224
中性
RSI(14)
46.335
中性
STOCH(KDJ)(9,3,3)
15.412
賣出
ATR(14)
1.211
高波動
CCI(14)
-89.385
中性
Williams %R
75.885
賣出
TRIX(12,20)
0.043
賣出
StochRSI(14)
0.000
超賣


開盤價
210.699昨日收盤價
211.152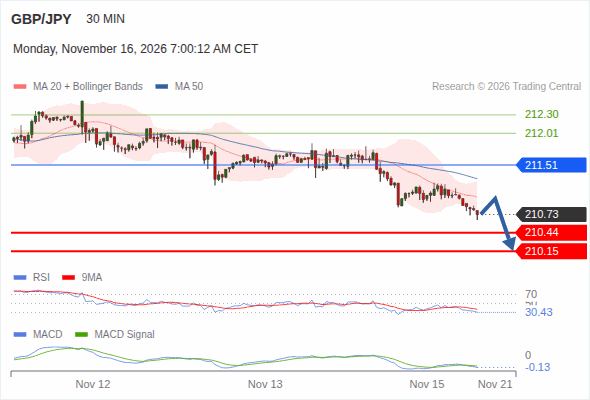
只要依舊存在 211.51 阻力位,就會保持下降趨勢,目標位為 210.44 和 210.15
在 211.51 之上,目標位為 212.01和 212.30。
只要依舊存在 211.51 阻力位,就會保持下降趨勢,目標位為 210.44 和 210.15
The GBP/JPY cross seesaws between tepid gains and minor losses on Friday, trading around mid-211.00s during the early European session, just above a one-and-a-half-week low, which it touched the previous day.
The GBP/JPY cross reverses a modest intraday dip, climbing back to the 212.00 mark during the early European session on Thursday, though it remains confined within a range held over the past week or so.
The GBP/JPY trades choppily despite posting gains of 0.17% on Wednesday, with price action remaining within Tuesday’s daily range of 211.44-212.65, indicating that a potential ‘bullish harami’ or inside day pattern is forming near a key resistance area.
The GBP/JPY cross attracts fresh sellers following an intraday uptick to the 212.15-212.20 area on Wednesday, retreating to the lower end of its daily range during the first half of the European session.
The GBP/JPY falls by about 0.22% as the US Dollar strengthens on hawkish comments from Federal Reserve (Fed) officials, boosting safe-haven currencies like the Japanese Yen against the Pound Sterling. The cross trades at 211.78.
GBP/JPY trades with a modest bullish bias on Tuesday but struggles to build on the previous day’s 0.32% gain. At the time of writing, the cross trades around 212.44, up 0.09% on the day, with the 100-day and 200-day Simple Moving Averages (SMAs) near 213.00 capping the immediate upside.
指標功能會自動分析出每種指標下各品種的數值與方向,並給出技術面的總結。
目前,我們會自動計算MACD、RSI、KDJ、StochRSI、ATR、CCI、WR、TRIX、MA九種技術指標,並且您可以自由切換時間週期。
需要注意的是,技術分析本身只是投資參考的一部分,並且用數值來判斷方向沒有絕對的標準。結果僅供參考,我們不對指標的計算準確性與分析結論負責。