

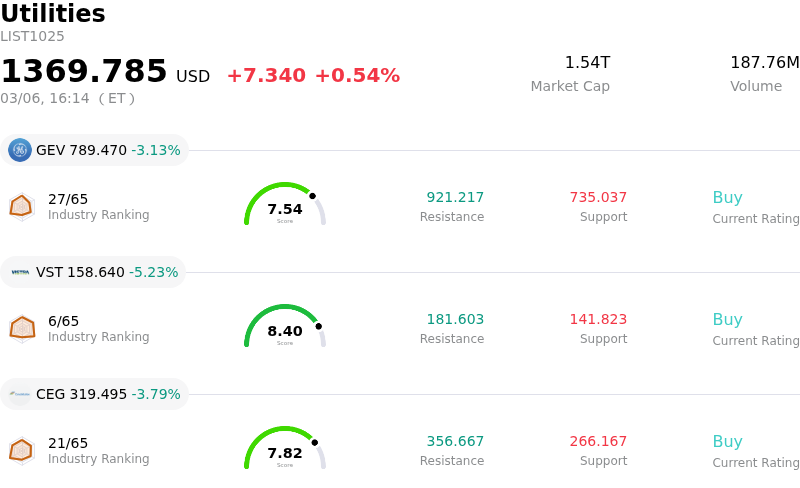
Ge Vernova Inc Stock (GEV) Closed Down by 3.13% on Mar 6: Drivers Behind the Movement

Ge Vernova Inc (GEV) closed down by 3.13%. The Utilities sector is up by 0.54%. The company underperformed the industry. Top 3 stocks by trading volume in the sector: Ge Vernova Inc (GEV) down 3.13%; Vistra Corp (VST) down 5.23%; Constellation Energy Corp (CEG) down 3.79%.
What is driving Ge Vernova Inc (GEV)’s stock price down today?
The downward movement in GEV's stock today appears to be largely influenced by a broad shift in market sentiment, rather than adverse company-specific news. Investor caution has heightened due to broader macroeconomic concerns, including persistent inflation pressures and ongoing debates surrounding potential interest rate adjustments by the Federal Reserve. This general risk aversion in the market is reflected in a significant increase in volatility. Furthermore, recent labor market data, such as the ADP Non-Farm Employment Change report for February, indicated a slowdown in private sector job additions, contributing to a cautious outlook on the economy.
Despite these broader market headwinds, specific company factors also played a role. GEV continues to face challenges within its offshore wind segment, which is expected to pressure margins in upcoming quarters due to project delays and tariff uncertainties. This segment's revenue saw a notable decline year-over-year, despite an increase in orders, raising questions about execution capabilities. Additionally, recent insider activity, including a Form 144 filing on March 2, 2026, indicating share sales tied to restricted vesting, and an executive officer selling shares on February 26, 2026, may have contributed to some negative perception among investors. While analysts remain largely positive on GEV, some concerns around the stock's valuation and the potential for a cooling in AI-driven power demand have also been noted.
It is important to note that these negative influences occurred despite several positive company-specific developments, such as robust fourth-quarter 2025 earnings that surpassed analyst expectations for both revenue and earnings per share. The company also recently announced an increased quarterly dividend and expanded its share repurchase authorization, alongside significant order growth, particularly in its Power and Electrification segments driven by demand from AI data centers. GEV also raised its fiscal year 2026 revenue guidance. However, on this particular day, the overarching market sentiment and specific operational risks weighed more heavily on investor decisions.
Technical Analysis of Ge Vernova Inc (GEV)
Technically, Ge Vernova Inc (GEV) shows a MACD (12,26,9) value of [40.36], indicating a neutral signal. The RSI at 52.76 suggests neutral condition and the Williams %R at -76.62 suggests oversold condition. Please monitor closely.
Fundamental Analysis of Ge Vernova Inc (GEV)
Ge Vernova Inc (GEV) is in the Utilities industry. Its latest annual revenue is $38.07B, ranking 2 in the industry. The net profit is $4.88B, ranking 3 in the industry. Company Profile
Over the past month, multiple analysts have rated the company as Buy, with an average price target of $845.03, a high of $1087.00, and a low of $424.45.
More details about Ge Vernova Inc (GEV)
Company Specific Risks:
- Ongoing execution challenges and potential financial losses in the Wind segment, specifically highlighted by the Vineyard Wind stop work order which could prevent billing on $250 million of revenue, alongside broader industry distress from offshore wind bans and tariffs.
- Potential for significant stock price correction due to a high valuation, as analysts suggest the stock is "priced for perfection" at 72.81x EV/aEBITDA, making it vulnerable to any disappointment in achieving ambitious growth and margin targets.
- Indication of potential liquidity constraints with a current ratio of 0.98 and a quick ratio of 0.75, suggesting tight working capital management and short-term financial flexibility challenges.
- Increased competitive pressure in key markets, including gas turbines where Chinese manufacturers offer 30-40% lower pricing, and wind turbine commoditization, threatening market share and future margin expansion.
This article may include AI-generated content that is human-reviewed, which is for reference and general information purposes only and does not constitute investment advice.
Recommended Articles


Comments (0)
Click the $ button, enter the symbol, and select to link a stock, ETF, or other ticker.