The Stock Market Sounds an Alarm for the First Time in 25 Years. Here Is What History Says Comes Next in 2026

Key Points
The stock market is valued near its most expensive levels ever.
Soaring valuations in artificial intelligence (AI) are echoing themes last seen during the dot-com bubble.
History has a flawless track record of predicting where the stock market should be headed in 2026.
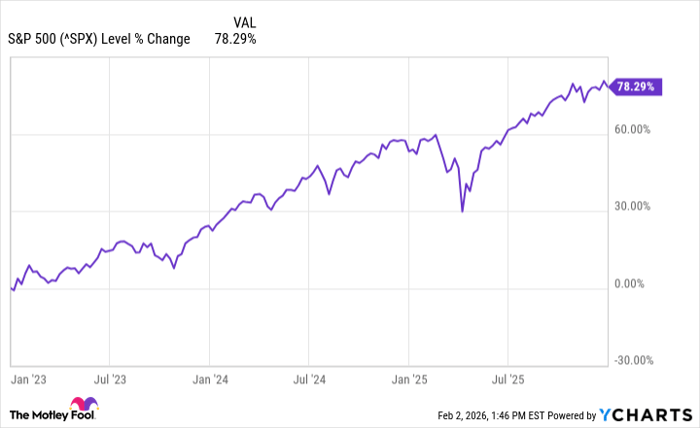
During the past century, the S&P 500 index (SNPINDEX: ^GSPC) has generated an average annual return of 7% (after inflation and dividend reinvestment are accounted for). The last three years have featured abnormally high returns, however, largely thanks to the artificial intelligence (AI) revolution.
Between 2023 and 2025, the S&P 500 gained a cumulative 78%. While some may think the stock market is destined for further rallying, smart investors understand that nothing rises forever.
Where to invest $1,000 right now? Our analyst team just revealed what they believe are the 10 best stocks to buy right now. Continue »
Let's dig into some important, but largely overlooked, themes of the market right now and assess why they are so important. Is the stock market going to crash this year? Read on the find out.
The stock market is flashing a warning sign last seen in the year 2000
It's not uncommon to hear analysts chirping about valuation metrics such as price-to-earnings (P/E) or forward P/E ratios. Indeed, these indicators can be useful. However, their shortfall is that they do not account for long-term trends.
In this regard, a more useful figure is the cyclically adjusted price-to-earnings (CAPE) ratio. The CAPE ratio accounts for inflation-adjusted earnings-per-share growth during a 10-year period. This helps weed out and normalize anomalies and economic cycles.
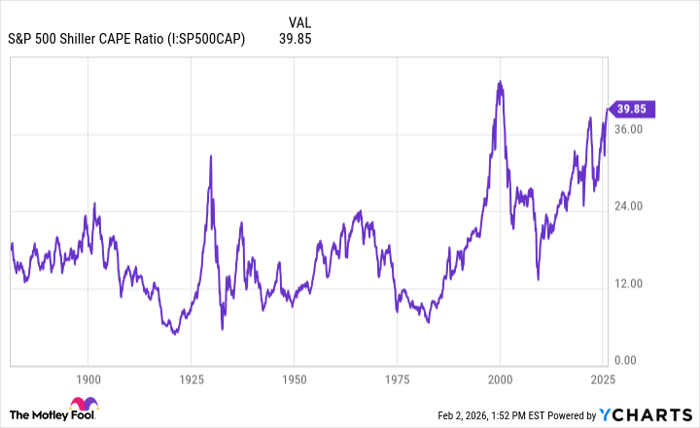
S&P 500 Shiller CAPE Ratio data by YCharts
Currently, the CAPE ratio sits just below 40. As the chart above illustrates, the CAPE ratio has hovered near its current level only twice before.
The first instance was back in the late 1920s. After reaching a then-historic peak, the S&P 500 crashed in epic fashion -- paving the way to the Great Depression.
In more recent history, the CAPE ratio reached an all-time high of 44 as unrelenting euphoria fueled the dot-com boom in the late 1990s. As investors will recall, the internet bubble burst in 2000, and the stock market crashed.
Image source: Getty Images.
Is the stock market going to crash in 2026?
History suggests that the stock market should crash in 2026. That said, I see some important distinctions between current market conditions and the past.
First, the dot-com bubble was fueled by speculation. In other words, many companies from that era did not have fully formed business plans or a real presence online. Instead, many companies simply implied that the internet would radically change them, without a real plan to capitalize on the technology.
The AI revolution is far different. While soaring stock prices mimic what investors witnessed in the late 1990s, this time around, it might actually be warranted. The largest AI developers in the world -- the "Magnificent Seven" -- are already collectively monetizing AI across silicon, enterprise software, cloud infrastructure, e-commerce, autonomous systems, robotics, consumer electronics, and more.
Taking this narrative one step further, hyperscalers are planning to spend more than $500 billion on AI infrastructure this year alone. Given these details, I find it hard to buy into the idea that the stock market and economy are headed for collapse in 2026.
I do think a brief pullback may occur. So while a sell-off might not be imminent or long-lasting, soaring asset prices could take a breather at some point.
With that in mind, I think a prudent way to approach portfolio management in 2026 is to do the following:
- Trim exposure to unprofitable, speculative stocks that you hope become multibaggers someday. These will be the first companies to experience harsh valuation declines should a correction occur.
- Hold on to blue chip stocks with durable, resilient business models. It's best to complement these with positions across various industries in a diversified portfolio.
- Stockpile cash for the time being. Building a healthy liquidity position will let you take advantage of any corrections and buy the dip.
Should you buy stock in S&P 500 Index right now?
Before you buy stock in S&P 500 Index, consider this:
The Motley Fool Stock Advisor analyst team just identified what they believe are the 10 best stocks for investors to buy now… and S&P 500 Index wasn’t one of them. The 10 stocks that made the cut could produce monster returns in the coming years.
Consider when Netflix made this list on December 17, 2004... if you invested $1,000 at the time of our recommendation, you’d have $431,111!* Or when Nvidia made this list on April 15, 2005... if you invested $1,000 at the time of our recommendation, you’d have $1,105,521!*
Now, it’s worth noting Stock Advisor’s total average return is 906% — a market-crushing outperformance compared to 195% for the S&P 500. Don't miss the latest top 10 list, available with Stock Advisor, and join an investing community built by individual investors for individual investors.
*Stock Advisor returns as of February 5, 2026.
Adam Spatacco has no position in any of the stocks mentioned. The Motley Fool has no position in any of the stocks mentioned. The Motley Fool has a disclosure policy.
Related Articles
Amazon Stock Predictions for 2026 to 2030: Will They Exceed Expectations and Achieve Major Long-Term Goals?
TradingKey - As we head into 2026, many investors are questioning where Amazon (AMZN) fits into the technology world.
A Crash After a Surge: Why Silver Lost 40% in a Week?
TradingKey - Spot silver (XAGUSD) prices continue to decline. Silver plunged 20% on Thursday, breaking below $71 per ounce, with the sell-off intensifying on Friday as prices fell further below $64. Compared to the all-time high set on January 29, silver prices have retraced more than 40%, wiping out nearly all gains accumulated over the previous month.
Is Bitcoin’s Four-Year Cycle Dead in 2026?
Is the Bitcoin 4-year cycle dead? After 2025 broke historical records with a red post-halving year, institutional analysts explore if the Bitcoin price has decoupled from the halving countdown. Analyze the impact of spot ETFs, global liquidity, and the roadmap to the 2028 halving in this 2026 market
Why Ripple ETFs are Winning the Capital War Against Bitcoin
While Bitcoin and Ethereum ETFs face massive outflows, XRP ETFs have defied market trends with a historic 30-day inflow streak reaching $1.37 billion. Explore why institutional "smart money" is rotating into Ripple, the structural impact of the "Liquidity Lock," and why analysts set a 2026 price tar