The Stock Market Is on the Verge of Doing Something Observed Only 2 Previous Times in 154 Years

Key Points
The Dow Jones Industrial Average, S&P 500, and Nasdaq Composite have soared 22%, 33%, and 46%, respectively, since bottoming out on April 8.
One of Wall Street's most time-tested valuation measures is flashing a historically accurate warning signal for investors.
History is a pendulum that swings in both directions and overwhelmingly favors investors with a long-term vision.
It's been quite the ride for the benchmark S&P 500 (SNPINDEX: ^GSPC), ageless Dow Jones Industrial Average (DJINDICES: ^DJI), and innovation-powered Nasdaq Composite (NASDAQINDEX: ^IXIC) in 2025.
Since a short-lived stock market crash in early April, which was kicked off by President Donald Trump unveiling his tariff and trade policy on April 2, Wall Street's major stock indexes have been off to the races. On April 9, the day Trump announced a 90-day pause on higher "reciprocal tariffs," the S&P 500, Dow Jones, and Nasdaq logged their largest single-day point gains in their respective histories.
Where to invest $1,000 right now? Our analyst team just revealed what they believe are the 10 best stocks to buy right now. Continue »
However, their gains over the last five months and some change have been, arguably, even more impressive. Since the closing bell on April 8, the Dow, S&P 500, and Nasdaq have rallied 22%, 33%, and 46%, respectively, with all three touching fresh all-time highs.
If things seem too good to be true, it's possible they just might be, based on what historical precedent tells us.

Image source: Getty Images.
The stock market is on the precipice of making ultra-rare history (and it's not good news)
With the exception of the five-week COVID-19 crash in February-March 2020 and the 2022 bear market, the bulls have effectively been in control for 15 of the last 16 years. While it's comforting (and perfectly normal) to see Wall Street's major stock indexes increase in value over time, it becomes a problem when corporate earnings fail to keep pace.
Most investors are probably familiar with the price-to-earnings (P/E) ratio as a go-to tool for evaluating the cheapness or priciness of a business relative to its peers or the broader market. A company's P/E ratio is arrived at by dividing its share price by its trailing-12-month earnings per share (EPS).
But the P/E ratio is far from flawless. It becomes practically useless during recessions and doesn't factor in corporate growth rates.
Comparatively, the S&P 500's Shiller P/E ratio, also known as the cyclically adjusted P/E ratio or CAPE ratio, is a much better assessor of value. The Shiller P/E is based on average inflation-adjusted EPS over the prior 10 years, which makes it ideal when evaluating Wall Street's health barometer, the S&P 500.
As of the closing bell on Sept. 15, the S&P 500's Shiller P/E clocked in with a multiple of 39.78. This represents the third-highest multiple during a continuous bull market when back-tested to January 1871 and is a 130% premium to the average multiple of 17.28 over the last 154 years.
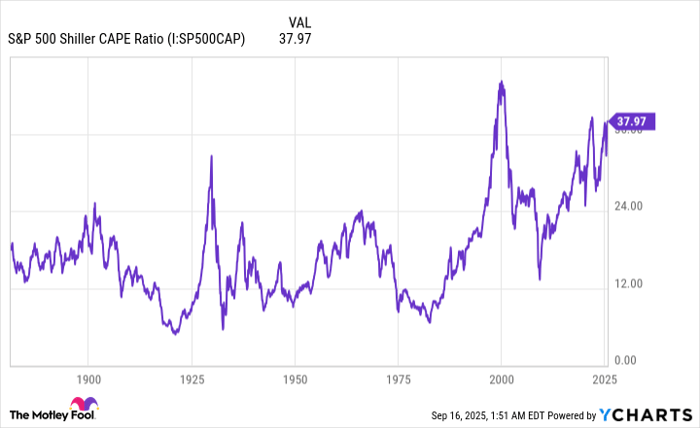
S&P 500 Shiller CAPE Ratio data by YCharts. CAPE Ratio = cyclically adjusted price-to-earnings ratio.
To put into perspective just how pricey the stock market is compared to one and a half centuries of back-tested data, the Shiller P/E has reached 40 on only two occasions:
- During the first week of January 2022, just prior to the start of the 2022 bear market, it crested 40 by a few hundredths.
- In December 1999, mere months before the dot-com bubble burst, the S&P 500's Shiller P/E hit an all-time high of 44.19.
The stock market is on the verge of making history, with the Shiller P/E one decent market up day away, as of this writing in the late evening of Sept. 15, from reaching a multiple of 40 for only the third time since 1871.
Why should it matter? The previous two times the Shiller P/E surpassed 40, the benchmark index lost 25% (2022 bear market) and 49% (dot-com bubble) of its value. The Nasdaq Composite was hit even harder, with a 78% peak-to-trough loss from 2000 to 2002.
Widening the lens even further shows that all five prior occurrences where the Shiller P/E surpassed 30 and held this level for at least two months were eventually met by declines of 20% (or more) in the S&P 500.
Though nothing is guaranteed on Wall Street, extended stock market valuations, as determined by the Shiller P/E on a back-tested basis, have consistently been a harbinger of bear markets for more than 150 years.

Image source: Getty Images.
Here's the silver lining amid this potentially history-making moment
While the Shiller P/E isn't a timing tool -- valuations can remain extended for weeks, months, or a couple of years, as they did prior to the dot-com bubble bursting -- it does portend eventual downside to come. Even though this historical prognostication might spoil what's been a truly euphoric rally on Wall Street over the last five months, it does come with a silver lining.
History is a pendulum that swings in both directions -- and it decisively favors those who possess a long-term vision and the perspective to see past short-term hiccups.
In June 2023, researchers at Bespoke Investment Group published a data set on X that compared the calendar-day lengths of every bull and bear market in the broad-based S&P 500 dating back to the start of the Great Depression in September 1929. This meant examining 27 separate bull and bear market events.
On one end of the spectrum, the typical S&P 500 bear market endured for just 286 calendar days, or approximately nine and a half months. Further, only eight of the 27 bear markets lasted longer than one year, with none surpassing 630 calendar days.
It's official. A new bull market is confirmed.
-- Bespoke (@bespokeinvest) June 8, 2023
The S&P 500 is now up 20% from its 10/12/22 closing low. The prior bear market saw the index fall 25.4% over 282 days.
Read more at https://t.co/H4p1RcpfIn. pic.twitter.com/tnRz1wdonp
In comparison, Bespoke found that the average S&P 500 bull market stuck around for 1,011 calendar days, which is roughly three and a half times as long. If the current bull market were extrapolated to present day, it would be the 14th bull market out of the 27 to last longer than the lengthiest bear market (630 calendar days).
If investors widen their lens even further, they can see just how much patience pays off on Wall Street.
Every year, the analysts at Crestmont Research refresh a data set where they calculate the rolling 20-year total return, which includes dividends, of the S&P 500 dating back to the start of the 20th century. Despite the S&P not being incepted until 1923, Crestmont was able to track the total return data of its components in other major indexes from 1900 to 1923. This yielded 106 rolling 20-year periods (1900-1919, 1901-1920, 1902-1921, and so on, to 2005-2024).
Crestmont's data set is an exercise in patience, because it shows that all 106 rolling 20-year periods produced positive annualized returns. In simple terms, if an investor had, hypothetically (since index funds didn't exist on U.S. exchanges until 1993), purchased an index fund that tracked the performance of the S&P 500 at any point between 1900 and 2005 and simply held their position for 20 years, they always came out ahead.
What's more, these gains weren't menial. Half of the 106 rolling 20-year periods examined produced annualized total returns of 9.3% to 17.1%, while the bottom decile averaged a respectable 5.1% annualized return.
Even if history proves accurate, once again, and a significant pullback awaits the S&P 500, Dow Jones Industrial Average, and Nasdaq Composite, all arrows continue to point higher when looking 20 or more years into the future.
Should you invest $1,000 in S&P 500 Index right now?
Before you buy stock in S&P 500 Index, consider this:
The Motley Fool Stock Advisor analyst team just identified what they believe are the 10 best stocks for investors to buy now… and S&P 500 Index wasn’t one of them. The 10 stocks that made the cut could produce monster returns in the coming years.
Consider when Netflix made this list on December 17, 2004... if you invested $1,000 at the time of our recommendation, you’d have $661,694!* Or when Nvidia made this list on April 15, 2005... if you invested $1,000 at the time of our recommendation, you’d have $1,082,963!*
Now, it’s worth noting Stock Advisor’s total average return is 1,067% — a market-crushing outperformance compared to 189% for the S&P 500. Don’t miss out on the latest top 10 list, available when you join Stock Advisor.
*Stock Advisor returns as of September 15, 2025
Sean Williams has no position in any of the stocks mentioned. The Motley Fool has no position in any of the stocks mentioned. The Motley Fool has a disclosure policy.
Recommended Articles