We're Closing in on the 2nd Priciest Stock Market in 154 Years -- and History Offers an Ominous Warning of What Comes Next

Key Points
Despite heightened volatility in 2025, the S&P 500, Nasdaq Composite, and Dow Jones Industrial Average have all powered their way to multiple record-closing highs.
Certain line-in-the-sand valuation thresholds have been a harbinger of (short-term) disaster for Wall Street's major stock indexes.
However, patience and perspective can dramatically alter the outcome for investors.
For more than a century, the stock market has stood tall as the premier wealth creator, with stocks generating a higher average annual return than bonds, commodities, and real estate. But getting from Point A to B can often be an adventure.
Just five months ago, the unveiling of President Donald Trump's tariff and trade policy sent the benchmark S&P 500 (SNPINDEX: ^GSPC), growth-fueled Nasdaq Composite (NASDAQINDEX: ^IXIC), and ageless Dow Jones Industrial Average (DJINDICES: ^DJI) spiraling lower. The S&P 500 endured its fifth-steepest two-day percentage decline since 1950, while the Nasdaq Composite plummeted into its first bear market in three years.
Where to invest $1,000 right now? Our analyst team just revealed what they believe are the 10 best stocks to buy right now. Continue »
However, sentiment on Wall Street can shift at the drop of a hat. Since President Trump announced a 90-day pause on higher "reciprocal tariffs" on April 9, the S&P 500, Nasdaq Composite, and Dow Jones Industrial Average have been off to the races, with all three indexes achieving multiple record-closing highs.
But this euphoria may soon be coming to an end, if history has its say.

Image source: Getty Images.
The stock market has rarely been pricier than it is right now
To preface the following discussion, historical precedent can't concretely guarantee what's going to happen in the future. If there was a metric or correlative event that could guarantee directional moves in the stock market, every investor would be using it by now.
With this being said, the stock market is making history on the valuation front -- and not in a good way.
Value tends to be a subjective term that varies from one individual to the next. What you consider to be expensive might be viewed as a bargain by another investor. This dynamic is one of the reasons the stock market can be so unpredictable.
When most investors "value" a stock, they turn to the time-tested price-to-earnings ratio (P/E), which is arrived at by dividing a company's share price by its trailing-12-month earnings per share (EPS). The P/E is a quick and easy way to evaluate mature businesses, but it's not without its faults. This traditional valuation measure doesn't account for a company's growth rate, and it can be rather useless during recessions and shock events (e.g., the pandemic).
When back-tested, arguably no valuation tool provides a more-encompassing, apples-to-apples comparison of stock valuations than the S&P 500's Shiller P/E ratio, which is also referred to as the cyclically adjusted P/E ratio (CAPE ratio).
The Shiller P/E is based on average inflation-adjusted EPS over the trailing decade. This means short-lived recessions and shock events won't skew valuation multiples.
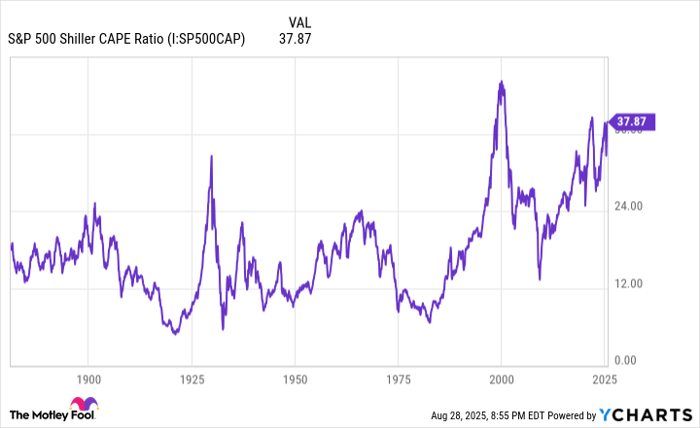
S&P 500 Shiller CAPE Ratio data by YCharts.
With the S&P 500 crossing above 6,500 for the first time in its storied history on Aug. 28, the Shiller P/E ratio closed at 39.18, which is its high-water mark for the current S&P 500 bull market. There are only two other periods spanning 154 years when the Shiller P/E has been higher:
- During the first week of January 2022, the S&P 500's Shiller P/E surpassed 40 by a few hundredths.
- In December 1999, the Shiller P/E hit its all-time high of 44.19.
Historical precedent comes into play when examining what has happened to stocks following these previous periods of premium valuations. The 2022 bear market wiped out a quarter of the S&P 500's value and lopped off more than a third of the Nasdaq's value.
Meanwhile, the dot-com bubble, which took shape just months after December 1999, saw the S&P 500 and Nasdaq Composite lose 49% and 78%, respectively, on a peak-to-trough basis.
In fact, any instance in which the S&P 500's Shiller P/E ratio has surpassed and sustained 30 for a period of at least two months has been a harbinger of significant downside. The S&P 500, Dow Jones, and/or Nasdaq Composite lost between 20% and 89% of their value following the five previous occurrences of the Shiller P/E topping 30.
With the stock market closing in on its second-priciest valuation since January 1871, history couldn't be clearer on what's to eventually come.

Image source: Getty Images.
Widening the lens leads to a completely different outlook
But there's a big difference in attempting to forecast short-term directional moves for Wall Street's major stock indexes and widening the lens to look at the big picture. While the Shiller P/E has an immaculate track record of forecasting eventual bear market downturns, few (if any) asset classes have proved more resilient over multiple decades than stocks.
The nonlinearity of economic and stock market cycles is one of the most-powerful catalysts working in favor of long-term investors.
For example, approximately 80 years have passed since the end of World War II. Since September 1945, the U.S. has navigated its way through a dozen recessions. The average recession has endured just 10 months, and none of these 12 downturns stuck around for longer than 18 months.
On the other end of the spectrum, the typical period of economic growth has endured for about five years, with two expansions surpassing the 10-year mark. Short-lived downturns and extended periods of growth are favorable to corporate EPS expansion over time.
This disparity between optimism and pessimism is even more apparent in the stock market.
It's official. A new bull market is confirmed.
-- Bespoke (@bespokeinvest) June 8, 2023
The S&P 500 is now up 20% from its 10/12/22 closing low. The prior bear market saw the index fall 25.4% over 282 days.
Read more at https://t.co/H4p1RcpfIn. pic.twitter.com/tnRz1wdonp
In June 2023, the analysts at Bespoke Investment Group published a data set on X (formerly Twitter) that examined the calendar length of every bull and bear market in the S&P 500 dating back to the start of the Great Depression in 1929.
Bespoke found the average S&P 500 decline of 20% or greater lasted just 286 calendar days, or approximately 9.5 months. But over this nearly 94-year stretch, the typical bull market was sustained for 1,011 calendar days, or two years and nine months.
While it's anyone's guess what might happen to stocks a month, six months, or even a year from now, patience and perspective have proved invaluable to investors willing to look to the horizon. The S&P 500 has never been down over any rolling 20-year period, including dividends, which is a strong endorsement for the U.S. economy and stocks in the decades to come.
Should you invest $1,000 in S&P 500 Index right now?
Before you buy stock in S&P 500 Index, consider this:
The Motley Fool Stock Advisor analyst team just identified what they believe are the 10 best stocks for investors to buy now… and S&P 500 Index wasn’t one of them. The 10 stocks that made the cut could produce monster returns in the coming years.
Consider when Netflix made this list on December 17, 2004... if you invested $1,000 at the time of our recommendation, you’d have $651,599!* Or when Nvidia made this list on April 15, 2005... if you invested $1,000 at the time of our recommendation, you’d have $1,067,639!*
Now, it’s worth noting Stock Advisor’s total average return is 1,049% — a market-crushing outperformance compared to 185% for the S&P 500. Don’t miss out on the latest top 10 list, available when you join Stock Advisor.
*Stock Advisor returns as of August 25, 2025
Sean Williams has no position in any of the stocks mentioned. The Motley Fool has no position in any of the stocks mentioned. The Motley Fool has a disclosure policy.
Recommended Articles