

The Current Bull Market Is 2 Years Old. History Says That Could Be Good News for Investors in 2025

Since the stock market became what it is today, it has switched between prolonged down periods and prolonged growth periods, known as bear and bull markets, respectively.
The stock market has had dozens of both bear and bull markets, but thankfully, investors have been enjoying a bull market for the past few years. On Oct. 12, 2022, the S&P 500 (SNPINDEX: ^GSPC) reached the bottom of its most recent bear market when it closed at 3,577.
Start Your Mornings Smarter! Wake up with Breakfast news in your inbox every market day. Sign Up For Free »
Since hitting that bottom, the stock market's most followed index has gone on a bull run, increasing close to 70% as of Dec. 15.
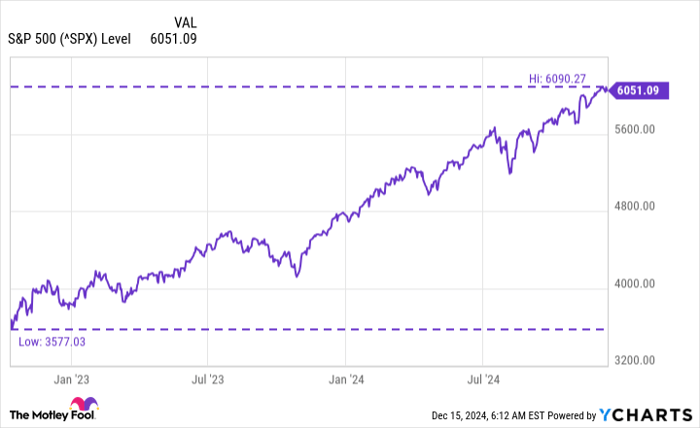
Data by YCharts.
With the current bull market a couple of months past its second birthday, there is some encouraging news for investors heading into 2025.
History is on the side of investors looking for continued momentum
Including the current one, there have been 17 bull markets since 1949 that have made it two full years. Though not all of them went on to last a full third year, 12 of them did.
| Bear Market End Date | Days In Bear Market | S&P 500 Change | First-Year Return | Second-Year Return | Third-Year Return |
|---|---|---|---|---|---|
| 6/13/1949 | 363 | (20.6%) | 40.0% | 14.5% | 12.9% |
| 10/22/1957 | 415 | (21.6%) | 31.5% | 9.7% | (4.8%) |
| 6/26/1962 | 196 | (28.0%) | 32.7% | 17.4% | 2.3% |
| 10/7/1966 | 605 | (22.2%) | 33.2% | 6.5% | N/A |
| 5/26/1970 | 543 | (36.1%) | 44.5% | 10.2% | N/A |
| 10/3/1974 | 630 | (48.2%) | 34.6% | 21.2% | (7.1%) |
| 3/6/1978 | 531 | (19.4%) | 12.8% | 15.2% | 16.9% |
| 8/12/1982 | 622 | (27.1%) | 57.7% | 2.0% | 13.9% |
| 12/4/1987 | 101 | (33.5%) | 21.4% | 29.0% | (8.0%) |
| 10/11/1990 | 87 | (19.9%) | 28.8% | 5.7% | 14.3% |
| 8/31/1998 | 45 | (19.3%) | 37.9% | 3.7% | N/A |
| 10/9/2002 | 929 | (49.1%) | 33.7% | 8.2% | 6.6% |
| 3/6/2009 | 514 | (56.8%) | 68.6% | 15.9% | 3.5% |
| 10/3/2011 | 157 | (19.4%) | 31.5% | 16.9% | 14.9% |
| 12/24/2018 | 95 | (19.8%) | 37.1% | 15.4% | 28.1% |
| 3/23/2020 | 33 | (33.9%) | 74.8% | 5.4% | N/A |
| 10/12/2022 | 282 | (25.4%) | 22.4% | 33.6% | TBD |
Data source: Carson Investment Research, Factset as of 10/08/2023. "N/A" indicates a full third year in the bull market wasn't accomplished. TBD = to be determined.
Of the 12 bull markets that made it a full third year, only three had negative returns in that third year, while six managed to produce double-digit gains. Not too shabby.
Don't take historical performance as a guarantee
I hate to be that guy, but I have to say it: Historical performance doesn't guarantee future performance. It can offer insight and help you see patterns, but it doesn't guarantee anything for the future, regardless of how strong the correlation may be.
In a logical world, history could be a straightforward predictor of the future. However, the stock market is notoriously irrational. Stock price movements are influenced by human behavior, including speculation, overconfidence, fear, and other emotions that often contradict conventional logic.
That's why it's important to be aware of history but not take it as the be-all and end-all when it comes to the stock market.
Keep your focus on being consistent
One thing to avoid is seeing a historical pattern and trying to time the market based on that. In this case, someone could see how often two-year-old bull markets make it a full third year with strong returns and decide that now is the time to rush to put money into the S&P 500 for near-term gains.
But your focus should instead be on remaining consistent and investing with a long-term mindset (ideally five years or more). Using a strategy like dollar-cost averaging can help avoid the itch to try to time the market because you put yourself on a strict investing schedule and stick to it no matter what stock prices are at the time.
The fear of missing out has caused investors to make many short-term moves that hurt them down the road. Be aware of historical patterns -- you can even be encouraged by them -- but long-term investing is what matters most.
Should you invest $1,000 in S&P 500 Index right now?
Before you buy stock in S&P 500 Index, consider this:
The Motley Fool Stock Advisor analyst team just identified what they believe are the 10 best stocks for investors to buy now… and S&P 500 Index wasn’t one of them. The 10 stocks that made the cut could produce monster returns in the coming years.
Consider when Nvidia made this list on April 15, 2005... if you invested $1,000 at the time of our recommendation, you’d have $790,028!*
Stock Advisor provides investors with an easy-to-follow blueprint for success, including guidance on building a portfolio, regular updates from analysts, and two new stock picks each month. The Stock Advisor service has more than quadrupled the return of S&P 500 since 2002*.
*Stock Advisor returns as of December 16, 2024
Stefon Walters has no position in any of the stocks mentioned. The Motley Fool has no position in any of the stocks mentioned. The Motley Fool has a disclosure policy.
Related Articles
National Debt Bomb Ignited? Musk Warns US Will Be 1000% Bankrupt Without AI
TradingKey - Tesla (TSLA) CEO Elon Musk recently issued another warning regarding the rapidly ballooning U.S. national debt. He stated clearly that without artificial intelligence and robotics, the United States will inevitably head toward fiscal bankruptcy.
Why Sanae Takaichi Winning Japan’s Diet Election Led to a Surge in Japanese Stock Indices?
TradingKey - Reports indicate that the ruling coalition led by Japanese Prime Minister Sanae Takaichi has secured a single-party majority in the parliamentary elections held on Sunday (February 8). Following the news, the yen weakened slightly, while the Nikkei Index surpassed 57,000 for the first t
A Crash After a Surge: Why Silver Lost 40% in a Week?
TradingKey - Spot silver (XAGUSD) prices continue to decline. Silver plunged 20% on Thursday, breaking below $71 per ounce, with the sell-off intensifying on Friday as prices fell further below $64. Compared to the all-time high set on January 29, silver prices have retraced more than 40%, wiping out nearly all gains accumulated over the previous month.
Is Bitcoin’s Four-Year Cycle Dead in 2026?
Is the Bitcoin 4-year cycle dead? After 2025 broke historical records with a red post-halving year, institutional analysts explore if the Bitcoin price has decoupled from the halving countdown. Analyze the impact of spot ETFs, global liquidity, and the roadmap to the 2028 halving in this 2026 market

