


Ethereum (ETHUSD) Is down 1.01% on Sep 30: Here Is Why



Ethereum (ETHUSD) is down 1.01% at Sep 30 02:40(ET), now at $2659.51, with a 7-day down of 0.35%.
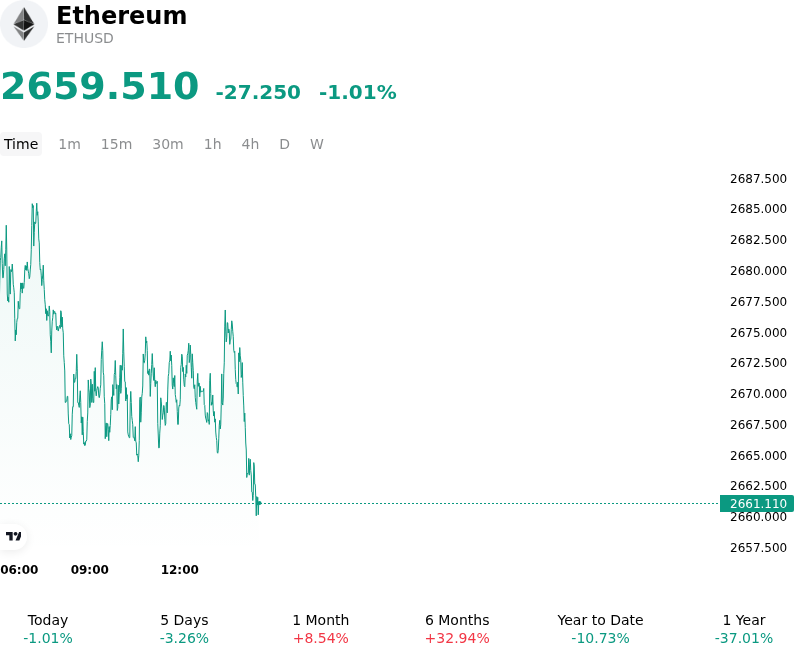
What is driving Ethereum (ETHUSD)’s stock price down today?
Quarter-end portfolio rebalancing, localized softening in spot ETF demand, and persistent macroeconomic headwinds drove a mild pull-back in Ethereum as institutional traders adjusted risk exposure into the close of the third quarter. With asset managers reallocating capital across portfolios ahead of quarter-end reporting, spot market liquidity experienced temporary sell-side pressure that muted buying interest across top-tier digital assets.
A primary catalyst for the session's weakness was a cooling in capital flows toward U.S. spot Ethereum ETFs. Following a stretch of robust inflows earlier in the month, institutional net allocations slowed, diminishing the consistent spot bid that had previously anchored price action. The temporary pause in fund inflows left the spot market more vulnerable to short-term order book imbalances and profit-taking.
Macroeconomic conditions continued to exert a restrictive drag on market sentiment. Firm U.S. Treasury yields and a resilient U.S. dollar, backed by lingering expectations that the Federal Reserve will maintain a restrictive policy stance, raised the opportunity cost of holding non-yielding digital assets. This macro backdrop restrained broader risk appetite, limiting speculative upside across altcoin markets and encouraging tactical derisking among institutional desks.
Derivatives market dynamics further exacerbated the downside, as a modest contraction in open interest was accompanied by light long liquidations across major perpetual swap contracts. The flushing of overleveraged long positions added brief downward momentum during early trading sessions, though market depth quickly absorbed the selling without triggering systemic leverage cascades.
Despite the intraday soft patch, Ethereum's underlying network fundamentals remain solid. Active address metrics, Layer-2 transaction volume, and long-term staking participation continue to reflect robust utility and structural network health. The current price adjustment represents a temporary, liquidity-driven consolidation influenced by macro yields and quarter-end flows rather than a deterioration in long-term adoption metrics.
Technical Analysis of Ethereum (ETHUSD)
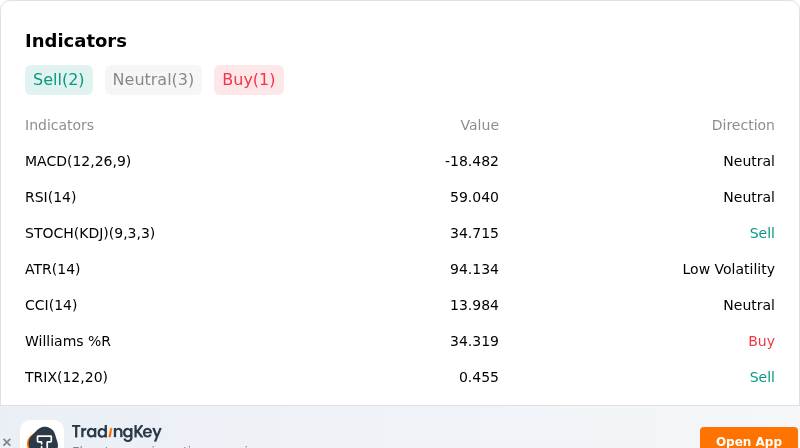
Technically, Ethereum (ETHUSD) shows a MACD (12,26,9) value of -18.482, indicating a neutral signal. The RSI at 59.040 suggests neutral condition and the Williams %R at 34.319 suggests buy condition. Please monitor closely.
More details about Ethereum (ETHUSD)
Recent Events and Risks:
- Spot ETF Outflows: U.S. spot Ethereum ETFs recorded a reversal to daily net outflows of $2.81 million, driven by significant redemptions from major funds including BlackRock's ETHA (-$8.94M) and Fidelity's FETH (-$6.7M), dampening recent institutional momentum.
- Leverage Concentration and Liquidation Cascades: On-chain derivative metrics highlight localized price fragility, with over $32 million in whale long positions facing immediate liquidation triggers between $2,613 and $2,631, exacerbating the risk of forced long-unwinding cascades during sharp intraday dips.
- Whale Offloading and Exchange Inflows: Recent large-scale OTC distribution—including a single whale selling 42,005 ETH ($111.9 million)—alongside a turn to positive exchange netflows indicates that large holders are moving tokens onto exchanges to de-risk.
- Regulatory Stagnation: Ongoing friction and legislative delays surrounding U.S. market structure policy (such as the stalling of the Clarity Act in Congress) continue to trigger defensive profit-taking and distribution among institutional-tier wallet cohorts.
This article may include AI-generated content that is human-reviewed, which is for reference and general information purposes only and does not constitute investment advice.
Recommended Articles









Comments (0)
Click the $ button, enter the symbol, and select to link a stock, ETF, or other ticker.