


Bloom Energy Surges Over 13%, Tops $300 Level as Jefferies Says Orders Support Growth Expectations



AI Podcast


On September 29 Eastern Time, Bloom Energy surged over 13%, driven by robust data center power demand and Morgan Stanley’s reiterated Overweight rating and $310 price target. Solid oxide fuel cells offer rapid deployment solutions for AI infrastructure. However, Jefferies maintains a Hold rating, highlighting execution risks tied to permitting, infrastructure constraints, and reliance on large-scale projects like Jupiter and Vineland. Technically, the stock rebounded above major moving averages and the 0.618 Fibonacci level ($277.16), though a sustained break above the 0.786 level ($309.79) is required to test historical highs, with downside risks remaining near moving average supports.
TradingKey - On September 29 Eastern Time, Bloom Energy (BE) surged over 13% in early trading, recovering all of yesterday's losses and hitting a new recent high.
Morgan Stanley maintained its "Overweight" rating and $310 price target on the stock, believing that signed projects, multi-gigawatt partnerships, and strong 2026 guidance are expected to cushion the impact of delays in individual project rollouts on near-term earnings.
Market expectations for data center power demand are an important backdrop to this rally. As AI data centers require continuous and stable power supply, Bloom Energy's solid oxide fuel cells have attracted attention. Such equipment can be deployed relatively quickly, providing on-site power, off-grid, or microgrid solutions for large cloud service providers and data centers.
However, institutions remain divided on the certainty of growth delivery. Jefferies raised its price target for Bloom Energy to $264, which is still about 10% away from the current price, while maintaining its "Hold" rating without an upgrade.
The firm believes that the logic of tapping into AI data center power demand through "behind-the-meter" power generation remains unchanged, with recent large orders and capacity expansion supporting growth prospects. However, several key projects still face uncertainties regarding air, water, natural gas supplies, and local approvals.
The firm noted that a significant portion of Bloom Energy's current revenue growth relies on a few large projects, making its financial performance more sensitive to the execution pace of individual projects. The Jupiter project is a prime example. The project was originally planned to use Bloom Energy fuel cells to power a large AI data center, but natural gas pipeline construction and local permitting issues have increased the risk of project delays. Projects like Vineland also face varying degrees of permitting and infrastructure constraints.
Jefferies therefore believes that Bloom Energy's current biggest risk is no longer whether it can secure customers, but whether these large-scale projects can complete permitting, construction, and revenue recognition according to the original timeline.
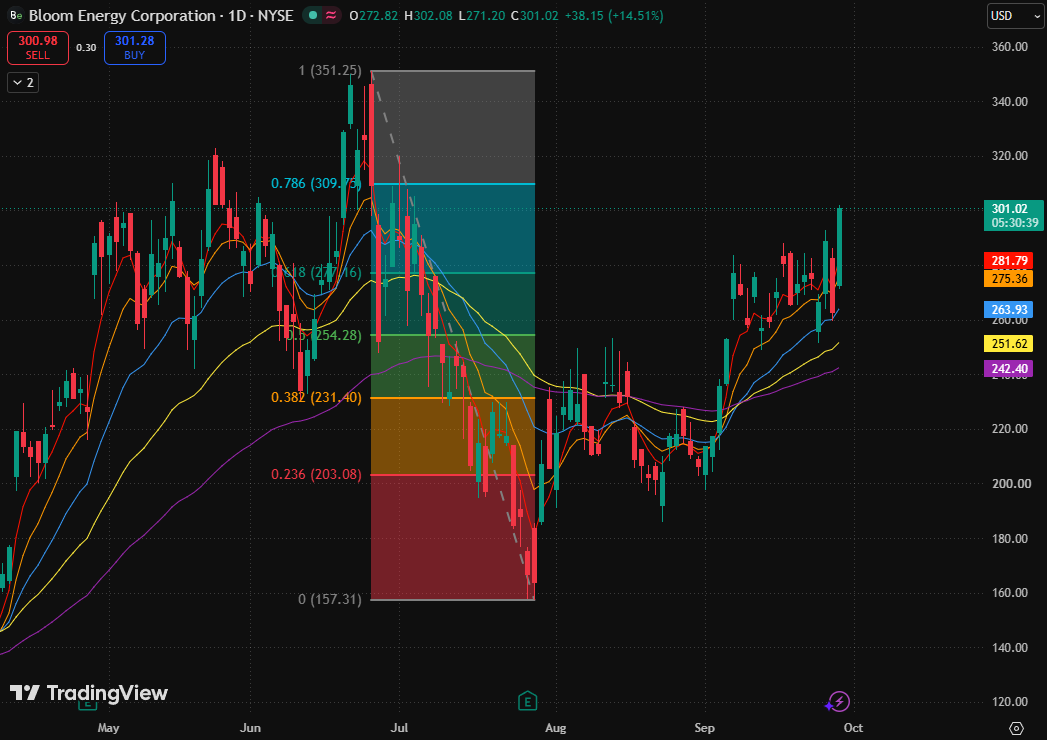
BE daily chart. Source: TradingView
Bloom Energy's stock price rebounded sharply from the steep drop in the previous trading session, climbing back above its 5-day moving average ($280.40), 10-day moving average ($274.60), 20-day moving average ($263.54), 80-day moving average ($251.41), and 160-day moving average ($242.30), while recovering the 0.618 Fibonacci retracement level ($277.16).
The current structure has shifted from a steep pullback near support back to a strong rebound, but it remains between the 0.618 and 0.786 Fibonacci retracement levels, having not yet broken through the 0.786 Fibonacci retracement level ($309.79).
On the upside, if the stock price continues to rise and breaks above the 0.786 Fibonacci retracement level ($309.79), the rally is expected to extend toward the historical high of $309.79.
If the breakout lacks momentum, the stock price could still return to the 0.618 Fibonacci retracement level ($277.16) to seek support. In a weaker scenario, it may further retest the support zone near the 20-day moving average ($263.54) and the 0.5 Fibonacci retracement level ($254.28).
This content was translated using AI and reviewed for clarity. It is for informational purposes only.
Recommended Articles












Comments (0)
Click the $ button, enter the symbol, and select to link a stock, ETF, or other ticker.