

Equinix Inc Stock (EQIX) Closed Down by 3.96% on Jun 30: Facts Behind the Movement

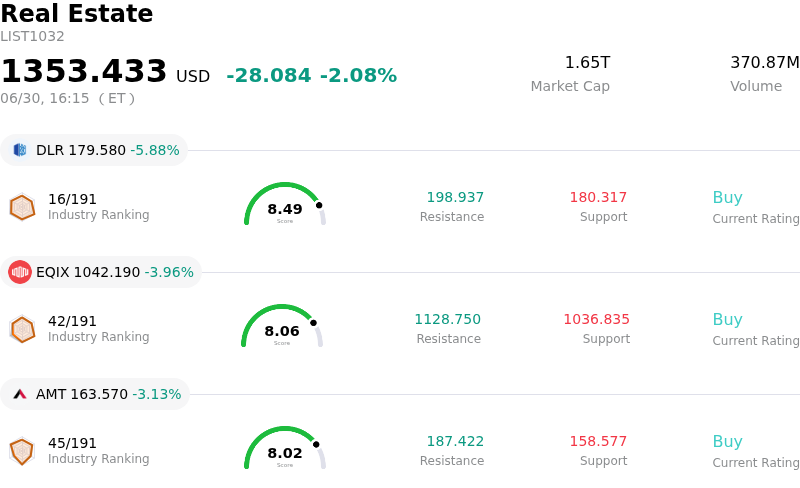
Equinix Inc (EQIX) closed down by 3.96%. The Real Estate sector is down by 2.08%. The company underperformed the industry. Top 3 stocks by turnover in the sector: Digital Realty Trust Inc (DLR) down 5.88%; Equinix Inc (EQIX) down 3.96%; American Tower Corp (AMT) down 3.13%.
What is driving Equinix Inc (EQIX)’s stock price down today?
The downward pressure and intraday volatility experienced by Equinix appear to be primarily driven by sector-wide weakness across real estate investment trusts and interest-rate-sensitive digital infrastructure assets, rather than any negative company-specific developments. After a strong year-to-date run, investors are engaging in profit-taking and rotating away from high-multiple, high-valuation stocks in the digital real estate category. This broader market rotation has caught Equinix in a wider selloff of infrastructure assets, overriding its otherwise constructive fundamental backdrop.
Adding to the selling pressure is a growing investor focus on the stock's valuation. Several discounted cash flow models and valuation metrics published in late June have highlighted that the company's recent rapid gains may have pushed its share price into overvalued territory relative to its intrinsic earnings-based value. This valuation stretch has prompted institutional portfolio adjustments and tactical selling. Even though major sell-side analysts, including Citigroup, recently raised their price targets and maintained positive outlooks on the stock's growth trajectory, short-term valuation resistance and profit realization after reaching near-peak levels have triggered a technical retracement.
Importantly, the fundamental thesis for Equinix remains intact, indicating that the current pullback is not linked to operational deterioration. The company’s most recent financial updates showed robust recurring revenue growth and an upward revision to its full-year financial guidance. Furthermore, Equinix continues to strengthen its competitive moat in the artificial intelligence sector, highlighted by its recently expanded collaboration with Cisco and Nvidia to deploy secure AI factories globally. While these partnerships underscore strong structural demand for the physical backbone of high-performance computing, macro-driven sector rotation and near-term overvaluation concerns are currently dominating market sentiment.
Technical Analysis of Equinix Inc (EQIX)
Technically, Equinix Inc (EQIX) shows a MACD (12,26,9) value of 2.210, indicating a buy signal. The RSI at 52.174 suggests neutral condition and the Williams %R at 42.240 suggests buy condition. Please monitor closely.
Media Coverage of Equinix Inc (EQIX)
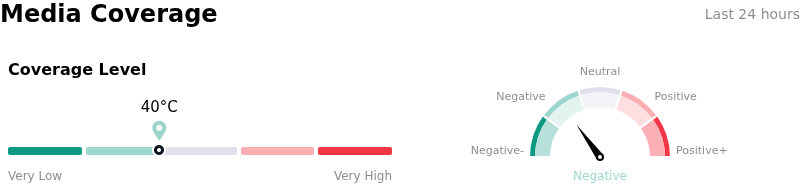
In terms of media coverage, Equinix Inc (EQIX) shows a coverage score of 40, indicating a low level of media attention. The overall market sentiment index is currently in bearish zone.
Fundamental Analysis of Equinix Inc (EQIX)
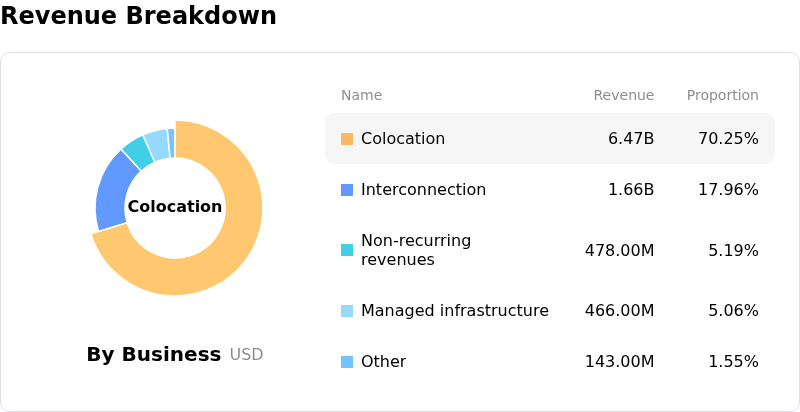
Equinix Inc (EQIX) is in the Real Estate industry. Its latest annual revenue is $9.22B, ranking 3 in the industry. The net profit is $1.35B, ranking 9 in the industry. Company Profile
Over the past month, multiple analysts have rated the company as Buy, with an average price target of $1181.18, a high of $1350.00, and a low of $846.00.
More details about Equinix Inc (EQIX)
Company Specific Risks:
- Macro Interest Rate Sensitivity: On June 30, 2026, EQIX experienced a 3.1% intraday selloff driven by sector-wide rotation away from rate-sensitive digital infrastructure and specialty Real Estate Investment Trusts (REITs). As a capital-intensive business model, Equinix remains highly exposed to elevated macro interest rates, which directly compress margins and drive institutional capital out of high-multiple yield assets.
- Severe Valuation Overhang: Discounted Cash Flow (DCF) and quantitative valuation models published on June 30, 2026, indicate that Equinix is trading at an extreme premium. With its stock price around $1,085, the earnings-based intrinsic value reflects a negative margin of safety of -183.3%. This is exacerbated by a Forward P/E of 25.33 compared to the specialty REIT industry average of 14.61, rendering the stock highly susceptible to profit-taking and multiple contraction.
- Bearish Technical Breakdown: Technical indicators show that EQIX has entered a strong bearish momentum phase, trading below both its 20-day moving average ($1,079) and 50-day moving average ($1,094). Momentum oscillators, including the Stochastic RSI, Commodity Channel Index (CCI), and a descending Ichimoku Kijun line acting as strong resistance at $1,073, indicate persistent downside pressure that threatens to drive the stock to a projected near-term target range of $1,010 to $1,072.
- Significant Insider Selling: Recent corporate disclosures reveal persistent executive liquidations, totaling $16.0 million in shares sold over the preceding quarter. This includes a Form 4 filed on behalf of Executive Vice President Brandi Galvin Morandi, who liquidated 37.8% of her direct holdings under a 10b5-1 trading plan, fueling concerns that internal management views the current AI-infrastructure-fueled pricing as near-peak valuation.
This article may include AI-generated content that is human-reviewed, which is for reference and general information purposes only and does not constitute investment advice.
Recommended Articles


Comments (0)
Click the $ button, enter the symbol, and select to link a stock, ETF, or other ticker.