

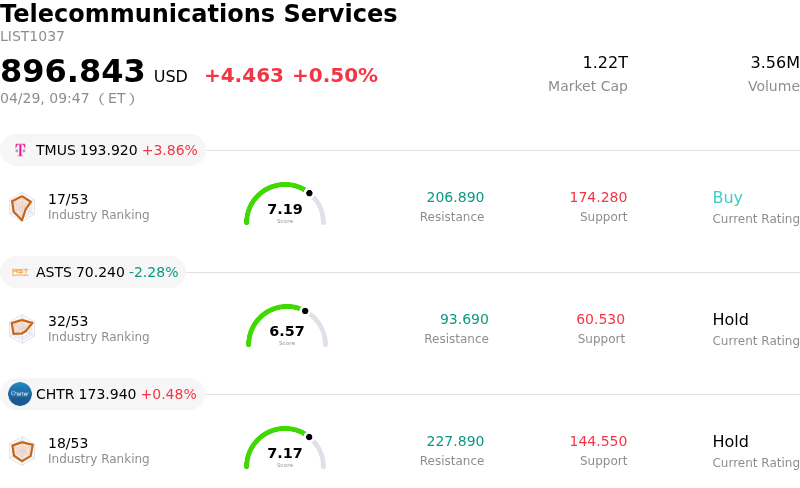
T-Mobile US Inc Stock (TMUS) Opened Up by 3.86% on Apr 29: Facts Behind the Movement

T-Mobile US Inc (TMUS) opened up by 3.86%. The Telecommunications Services sector is up by 0.50%. The company outperformed the industry. Top 3 stocks by turnover in the sector: T-Mobile US Inc (TMUS) up 3.86%; AST SpaceMobile Inc (ASTS) down 2.28%; Charter Communications Inc (CHTR) up 0.48%.
What is driving T-Mobile US Inc (TMUS)’s stock price up today?
T-Mobile US (TMUS) experienced significant upward movement in its share price today, primarily driven by strong financial performance and positive shifts in analyst sentiment. The company reported robust first-quarter 2026 results that surpassed Wall Street's expectations for both revenue and earnings per share. This impressive financial data underscored the company's operational strength.
Adding to the positive momentum, T-Mobile also raised its full-year guidance across several key metrics. This includes increased projections for postpaid net account additions, Core Adjusted EBITDA, net cash from operating activities, and Adjusted Free Cash Flow, signaling heightened confidence in its future operational trajectory and growth prospects.
Furthermore, the company benefited from favorable adjustments in analyst forecasts. Oppenheimer upgraded T-Mobile US to an 'Outperform' rating from 'Perform' and established a new price target. This upgrade reflects growing confidence among analysts in T-Mobile's ability to navigate the competitive telecommunications landscape and suggests substantial upside potential. The company's expansion into the fixed-wireless broadband market also continues to strengthen its market position and diversify its revenue streams.
Moreover, T-Mobile has demonstrated a strong commitment to shareholder returns, accelerating its share repurchase program and increasing its authorized stockholder returns for 2026. This, coupled with indications that the stock may be undervalued according to certain intrinsic value assessments, further contributed to the positive market reaction. The significant increase in postpaid net account additions and growth in average revenue per account also highlighted strong customer momentum.
Technical Analysis of T-Mobile US Inc (TMUS)
Technically, T-Mobile US Inc (TMUS) shows a MACD (12,26,9) value of [-4.55], indicating a sell signal. The RSI at 37.25 suggests neutral condition and the Williams %R at -80.99 suggests oversold condition. Please monitor closely.
Fundamental Analysis of T-Mobile US Inc (TMUS)
T-Mobile US Inc (TMUS) is in the Telecommunications Services industry. Its latest annual revenue is $88.31B, ranking 4 in the industry. The net profit is $10.99B, ranking 4 in the industry. Company Profile
Over the past month, multiple analysts have rated the company as Buy, with an average price target of $263.26, a high of $310.00, and a low of $223.00.
More details about T-Mobile US Inc (TMUS)
Company Specific Risks:
- Net income declined by 15% year-over-year in Q1 2026, primarily due to $476 million in UScellular merger-related costs, including accelerated depreciation, which also led to a 12% decrease in diluted EPS.
- Potential full combination with Deutsche Telekom via an all-share structure introduces significant uncertainty regarding execution, regulatory approval, and potential shareholder dilution, exerting near-term pressure on the stock.
- The wireless market faces intense competitive and pricing pressure, with analysts warning of a "brutal, margin-crushing price war" that could negatively impact T-Mobile's margins and growth prospects.
- A premium valuation (18.8x forward GAAP earnings) compared to peers leaves T-Mobile with little room for error, making the stock highly susceptible to multiple compression if growth metrics or execution on new initiatives disappoint.
This article may include AI-generated content that is human-reviewed, which is for reference and general information purposes only and does not constitute investment advice.
Recommended Articles


Comments (0)
Click the $ button, enter the symbol, and select to link a stock, ETF, or other ticker.