

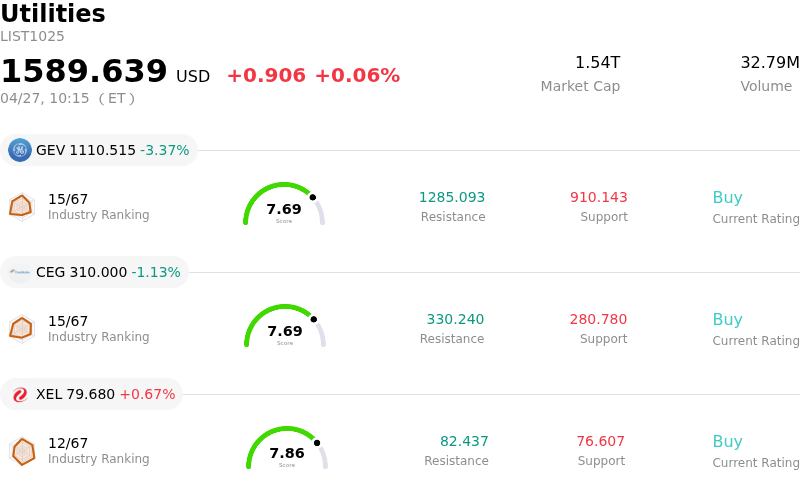
Ge Vernova Inc Stock (GEV) Moved Down by 3.37% on Apr 27: What Signal Does It Send?

Ge Vernova Inc (GEV) moved down by 3.37%. The Utilities sector is up by 0.06%. The company underperformed the industry. Top 3 stocks by turnover in the sector: Ge Vernova Inc (GEV) down 3.37%; Constellation Energy Corp (CEG) down 1.13%; Xcel Energy Inc (XEL) up 0.67%.
What is driving Ge Vernova Inc (GEV)’s stock price down today?
GEV is experiencing downward intraday movement, likely influenced by a combination of factors following a period of significant upward momentum. The company recently reported robust first-quarter 2026 financial results on April 22, exceeding revenue and earnings per share estimates. This strong performance was underpinned by substantial order growth, particularly from demand related to AI data centers and grid modernization, leading to a significant increase in backlog. Management subsequently raised its full-year 2026 guidance for revenue, adjusted EBITDA margin, and free cash flow.
Despite the overwhelmingly positive earnings report and subsequent upgrades to price targets from several analysts, the stock had already seen a substantial rally, reaching an all-time high on April 23. This rapid appreciation has led to elevated valuation concerns, with some analysts noting the stock trades at a high forward price-to-earnings ratio, suggesting it may be considered overvalued. Today's price action could reflect a natural period of profit-taking by investors after the recent surge, especially given the stock's extended gains.
Furthermore, persistent headwinds in the Wind segment continue to present a challenge. This segment remained loss-making in the first quarter, with decreased revenue attributed to lower onshore equipment deliveries and the impact of tariffs. Projected tariff costs for 2026 also represent an ongoing concern for profitability in this area. While the Power and Electrification segments demonstrated strong performance, the underperformance of the Wind business, alongside some insider selling activity over the past three months, could contribute to investor caution and contribute to the current intraday volatility.
Technical Analysis of Ge Vernova Inc (GEV)
Technically, Ge Vernova Inc (GEV) shows a MACD (12,26,9) value of [47.56], indicating a buy signal. The RSI at 80.43 suggests overbought condition and the Williams %R at -10.82 suggests oversold condition. Please monitor closely.
Fundamental Analysis of Ge Vernova Inc (GEV)
Ge Vernova Inc (GEV) is in the Utilities industry. Its latest annual revenue is $38.07B, ranking 2 in the industry. The net profit is $4.88B, ranking 4 in the industry. Company Profile
Over the past month, multiple analysts have rated the company as Buy, with an average price target of $1150.21, a high of $1424.00, and a low of $610.22.
More details about Ge Vernova Inc (GEV)
Company Specific Risks:
- Ongoing legal dispute with Vineyard Wind creates uncertainty around cash flow, costs, and revenue recognition, as the developer has reportedly withheld over $300 million.
- The Wind segment posted EBITDA losses in Q1 2026 due to lower equipment deliveries and higher contract losses, with tariff impacts projected to incur a net cost of $250-$350 million in 2026.
- Execution risk remains elevated for the record $163 billion backlog, particularly on long-cycle, fixed-price customer contracts, where procurement, schedule, labor, or logistics issues could lead to reduced margins or losses.
- The stock's premium valuation, trading at approximately 37x forward earnings and noted as "overbought," makes it highly sensitive to shifts in market sentiment regarding AI data center growth or broader electrification demand.
This article may include AI-generated content that is human-reviewed, which is for reference and general information purposes only and does not constitute investment advice.
Recommended Articles


Comments (0)
Click the $ button, enter the symbol, and select to link a stock, ETF, or other ticker.