

US Dollar Index Price Forecast: Tests immediate support at 103.50 near four-month lows

- The US Dollar Index may test its primary support at the four-month low of 103.34.
- The 14-day RSI remains below 30, indicating oversold conditions and the potential for an upward correction.
- On the upside, initial resistance is seen at the nine-day EMA at 104.34.
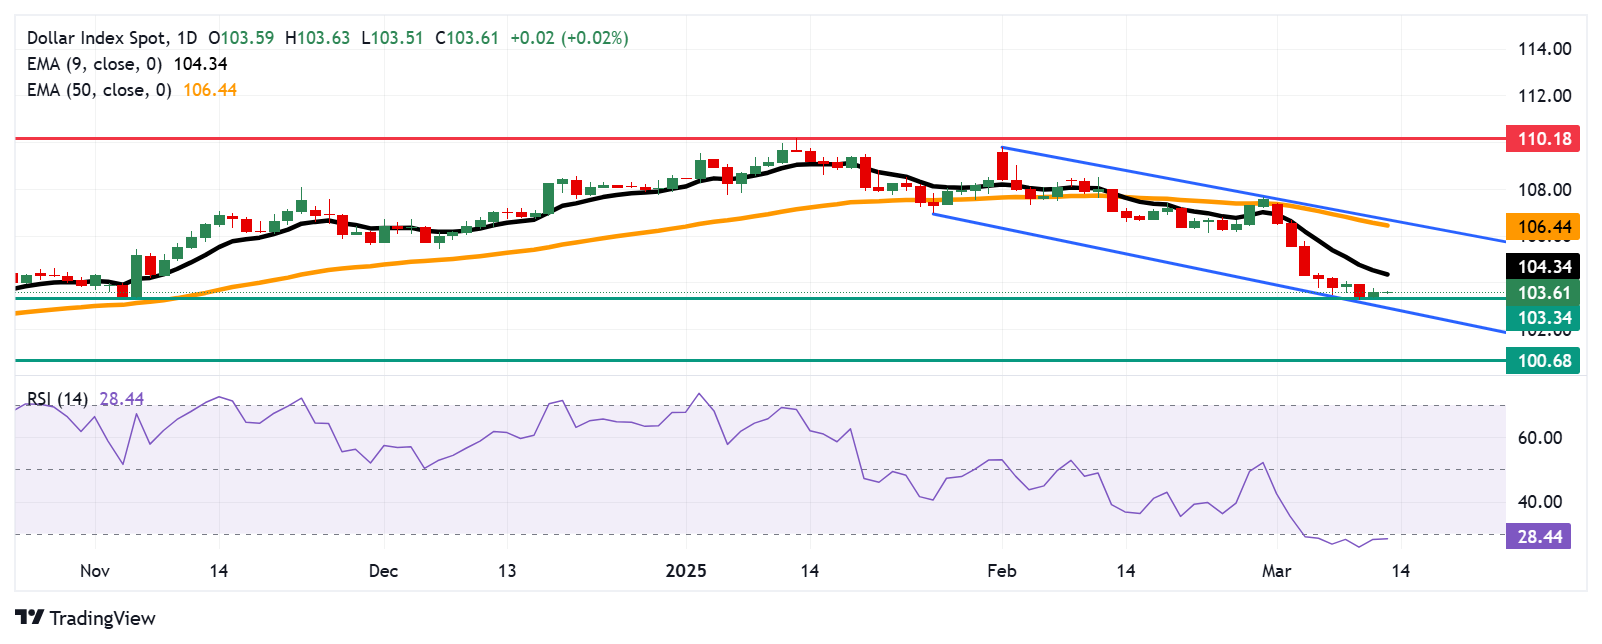
The US Dollar Index (DXY), which measures the value of the US Dollar (USD) against its six major peers, remains steady after registering gains in the previous session, trading around 103.60 during the Asian hours on Thursday. However, the technical analysis of the daily chart indicates a persistent bearish bias, with the index moving downwards within a descending channel pattern.
The US Dollar Index is trading below the nine- and 50-day Exponential Moving Averages (EMAs), indicating a weakening short- and medium-term trend. However, the 14-day Relative Strength Index (RSI) remains below 30, suggesting oversold conditions and the potential for an upward correction.
On the downside, the US Dollar Index may test its primary support at the four-month low of 103.34, recorded on November 6, followed by the lower boundary of the descending channel at 103.00. A break below this critical support zone could strengthen the bearish outlook, pushing the index toward the five-month low of 100.68.
The DXY may encounter initial resistance at the nine-day EMA at 104.34. A break above this level could strengthen short-term price momentum, pushing the index toward the 50-day EMA at 106.44, followed by the upper boundary of the descending channel at 106.70.
US Dollar Index: Daily Chart
US Dollar PRICE Today
The table below shows the percentage change of US Dollar (USD) against listed major currencies today. US Dollar was the strongest against the Australian Dollar.
| USD | EUR | GBP | JPY | CAD | AUD | NZD | CHF |
|---|---|---|---|---|---|---|---|---|
USD |
| 0.07% | 0.07% | -0.34% | 0.17% | 0.29% | 0.12% | -0.07% |
EUR | -0.07% |
| 0.00% | -0.40% | 0.09% | 0.23% | 0.08% | -0.14% |
GBP | -0.07% | -0.01% |
| -0.40% | 0.09% | 0.22% | 0.07% | -0.11% |
JPY | 0.34% | 0.40% | 0.40% |
| 0.47% | 0.63% | 0.46% | 0.30% |
CAD | -0.17% | -0.09% | -0.09% | -0.47% |
| 0.15% | -0.02% | -0.21% |
AUD | -0.29% | -0.23% | -0.22% | -0.63% | -0.15% |
| -0.15% | -0.31% |
NZD | -0.12% | -0.08% | -0.07% | -0.46% | 0.02% | 0.15% |
| -0.15% |
CHF | 0.07% | 0.14% | 0.11% | -0.30% | 0.21% | 0.31% | 0.15% |
|
The heat map shows percentage changes of major currencies against each other. The base currency is picked from the left column, while the quote currency is picked from the top row. For example, if you pick the US Dollar from the left column and move along the horizontal line to the Japanese Yen, the percentage change displayed in the box will represent USD (base)/JPY (quote).
Recommended Articles


Comments (0)
Click the $ button, enter the symbol, and select to link a stock, ETF, or other ticker.