

EUR/JPY Price Forecast: Bears test 100-day SMA after range breakdown

- EUR/JPY advances after Japan’s Q4 GDP misses forecasts, pressuring the Yen.
- Technical setup shows fading bullish momentum after a break below the 50-day SMA.
- Key support seen at 180.83 and 178.00; resistance stands at 183.66 and 186.00-87.00.
The Euro (EUR) strengthens against the Japanese Yen (JPY) on Monday, as the Yen comes under pressure following softer-than-expected Gross Domestic Product (GDP) data from Japan. At the time of writing, EUR/JPY is trading around 181.76, up nearly 0.20% on the day.
Preliminary data showed that Japan’s economy expanded by just 0.1% on a quarterly basis in the fourth quarter, missing market expectations of 0.4%, though rebounding from the previous contraction of -0.7%.
On an annualized basis, GDP rose 0.2%, well below the 1.6% forecast, but marking an improvement from the sharp -2.6% decline recorded in the prior quarter. Meanwhile, the GDP Deflator, a broad measure of inflation across the economy, eased slightly to 3.4% YoY in Q4 from 3.5%.
The softer growth momentum reinforces concerns about the strength of Japan’s recovery, as investors reassess the scope for near-term monetary policy tightening by the Bank of Japan (BoJ).
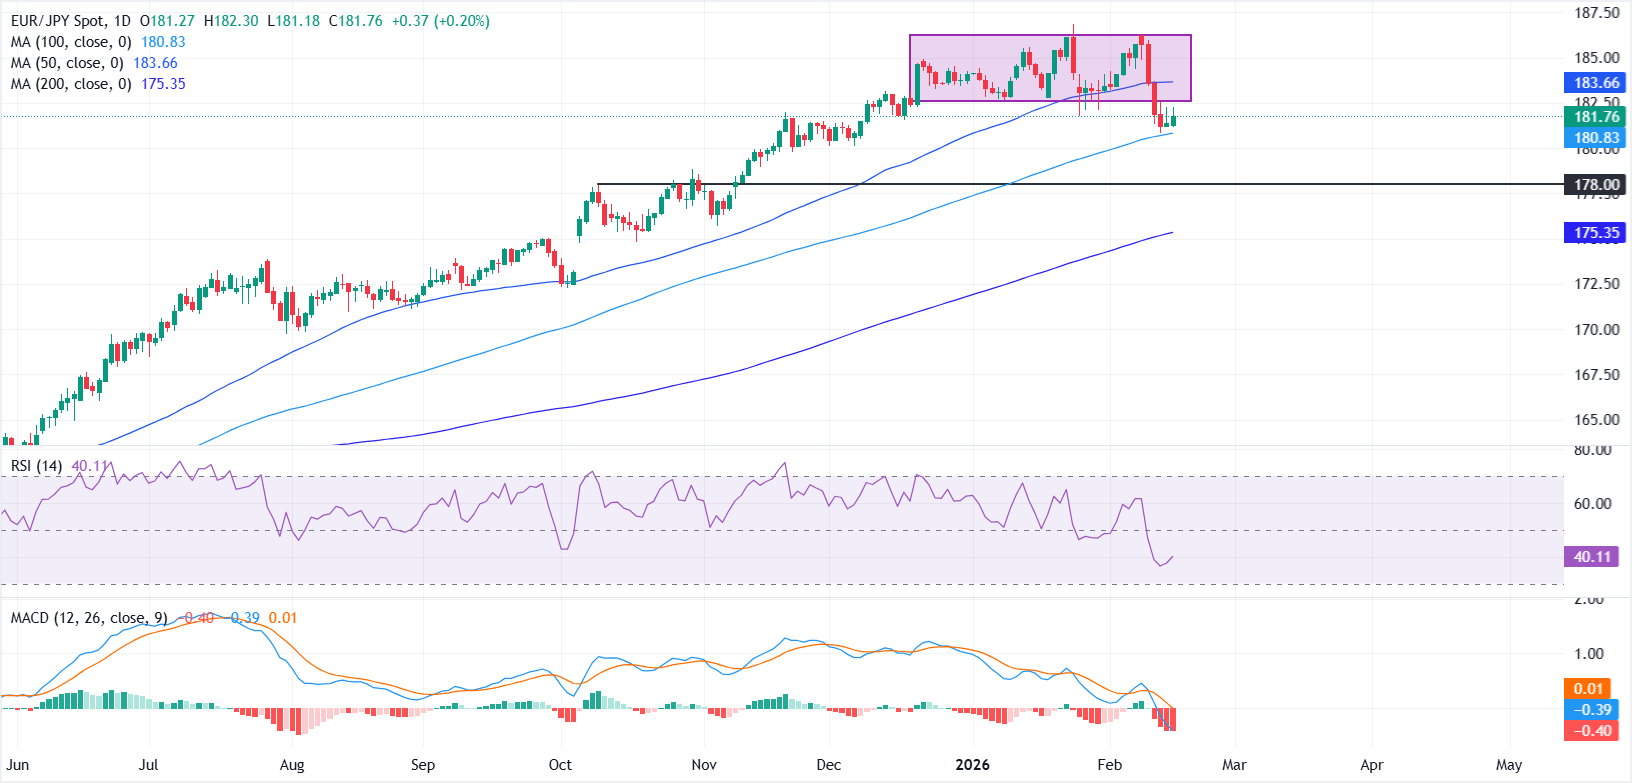
From a technical perspective, GBP/JPY has broken below the 50-day Simple Moving Average (SMA) and the 186.50-182.50 consolidation band that had contained price action since mid-December, tilting the short-term bias slightly to the downside.
That said, the broader structure remains constructive. The 50-day SMA is still positioned above both the 100-day and 200-day SMAs and continues to slope higher, keeping the uptrend in place.
On the downside, the 100-day SMA near 180.83 is acting as immediate support. A sustained break below this level could expose the 178.00 psychological mark, followed by the 200-day SMA near 175.35 as the next major support zone.
On the upside, failure to reclaim the 50-day SMA at 183.66 may keep recovery attempts in check. However, a decisive move back above this level could encourage buyers to challenge the upper boundary of the former consolidation range near 186.00–187.00, with scope for an extension toward the 190.00 handle.
Momentum indicators lean slightly bearish. The Moving Average Convergence Divergence (MACD) remains below the zero line, with a negative histogram and the MACD line holding beneath the Signal line, pointing to fading upside momentum.
Meanwhile, the Relative Strength Index (RSI) prints near 40, below its midline and comfortably away from oversold territory, reinforcing a mild bearish bias in the near term.
Japanese Yen Price Today
The table below shows the percentage change of Japanese Yen (JPY) against listed major currencies today. Japanese Yen was the strongest against the Swiss Franc.
| USD | EUR | GBP | JPY | CAD | AUD | NZD | CHF | |
|---|---|---|---|---|---|---|---|---|
| USD | 0.18% | 0.18% | 0.38% | 0.12% | 0.09% | 0.16% | 0.21% | |
| EUR | -0.18% | 0.00% | 0.22% | -0.05% | -0.08% | -0.02% | 0.03% | |
| GBP | -0.18% | -0.00% | 0.19% | -0.06% | -0.09% | -0.03% | 0.03% | |
| JPY | -0.38% | -0.22% | -0.19% | -0.28% | -0.30% | -0.23% | -0.18% | |
| CAD | -0.12% | 0.05% | 0.06% | 0.28% | -0.02% | 0.05% | 0.10% | |
| AUD | -0.09% | 0.08% | 0.09% | 0.30% | 0.02% | 0.07% | 0.11% | |
| NZD | -0.16% | 0.02% | 0.03% | 0.23% | -0.05% | -0.07% | 0.05% | |
| CHF | -0.21% | -0.03% | -0.03% | 0.18% | -0.10% | -0.11% | -0.05% |
The heat map shows percentage changes of major currencies against each other. The base currency is picked from the left column, while the quote currency is picked from the top row. For example, if you pick the Japanese Yen from the left column and move along the horizontal line to the US Dollar, the percentage change displayed in the box will represent JPY (base)/USD (quote).
Recommended Articles


Comments (0)
Click the $ button, enter the symbol, and select to link a stock, ETF, or other ticker.