

Micron Stock Price Breaks $1,000. Memory Chip Demand May Drive Shares to $1,400


AI Podcast
Micron's stock price surpassed $1,000, reaching $1,035.68 on June 1, driven by strong AI-fueled demand for memory chips. This demand, particularly for High Bandwidth Memory (HBM), is crucial for AI server performance. Unlike previous cycles, a tighter supply-demand balance is anticipated due to HBM capacity constraints and customer long-term agreements. UBS analyst Timothy Arcuri raised Micron's price target to $1,625, projecting DRAM tightness until Q2 2028 and NAND until Q4 2027. AI PCs represent another growth driver. Technical analysis suggests continued bullish momentum with potential upside targets around $1,384.

TradingKey - On June 1, Eastern Time, benefiting from tight demand for memory chips, Micron (MU) shares successfully broke through the $1,000 round-number milestone. By the close of the U.S. market that day, Micron's stock price stood at $1,035.68, with its market capitalization climbing to approximately $1.18 trillion.
Sustained Demand for Memory Chips Continues to Support Micron’s Stock Price
The core reason for the sustained rise in Micron's stock price is the demand for memory chips driven by AI computing power.
In the past, the market focused on NVIDIA GPUs, but the training and inference of large models require more than just computing chips; they also require HBM, DRAM, and high-speed storage to continuously supply data to GPUs. As the scale of AI servers expands, it has driven a surge in demand for High Bandwidth Memory (HBM), which is a key supporting component for GPU clusters. Without sufficient HBM, even if NVIDIA ( NVDA ), AMD and other manufacturers possess powerful AI chips, it remains difficult to complete high-performance training and inference deployments.
Notably, the supply-demand structure for memory chips this time may be tighter than in previous cycles. The problem with the traditional memory industry is that manufacturers expand production after prices rise, leading to subsequent oversupply and falling prices, with stock prices fluctuating significantly with the cycle. However, the market now believes this cycle could be extended. On one hand, HBM capacity expansion is difficult and consumes more wafer capacity; on the other hand, large cloud service providers and AI customers are more willing to lock in supply through long-term agreements.
UBS analyst Timothy Arcuri believes that Micron will continue to see its stock price rise, benefiting from strong AI-driven memory demand, persistent supply shortages, and higher revenue visibility from long-term agreements. He has significantly raised his price target for Micron from $535 to $1,625. He expects DRAM supply tightness to persist until at least the second quarter of 2028 and NAND tightness to last until the fourth quarter of 2027.
Additionally, AI PCs have become a new source of incremental growth. According to media reports, NVIDIA is set to launch the RTX Spark chip for AI PCs. The market believes these products will have higher requirements for memory capacity, and Micron is poised to benefit.
Micron Technical Analysis: Upside Potential to $1,400 Has Opened
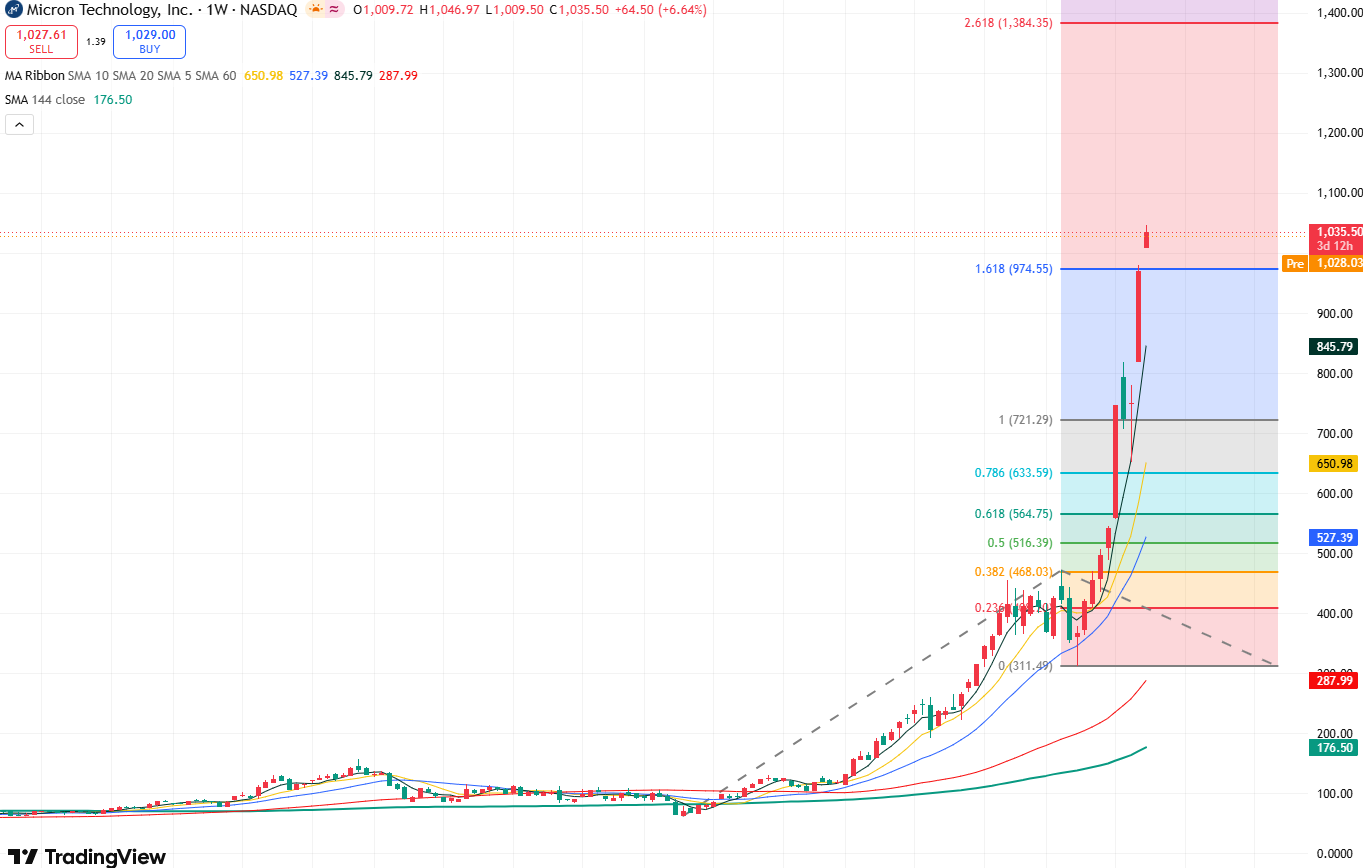
Micron Technology weekly stock chart, Source: TradingView
From Micron's weekly chart, the stock price trend exhibits a strong upward momentum, and the moving average system maintains a bullish alignment, suggesting that the mid-to-long-term trend remains bullish and highly sustainable.
Currently, as Micron's stock price breaks through the Fibonacci 1.618 extension resistance at $974 and further breaches the $1,000 psychological level, the upside potential toward the Fibonacci 2.618 extension at $1,384 has opened up.
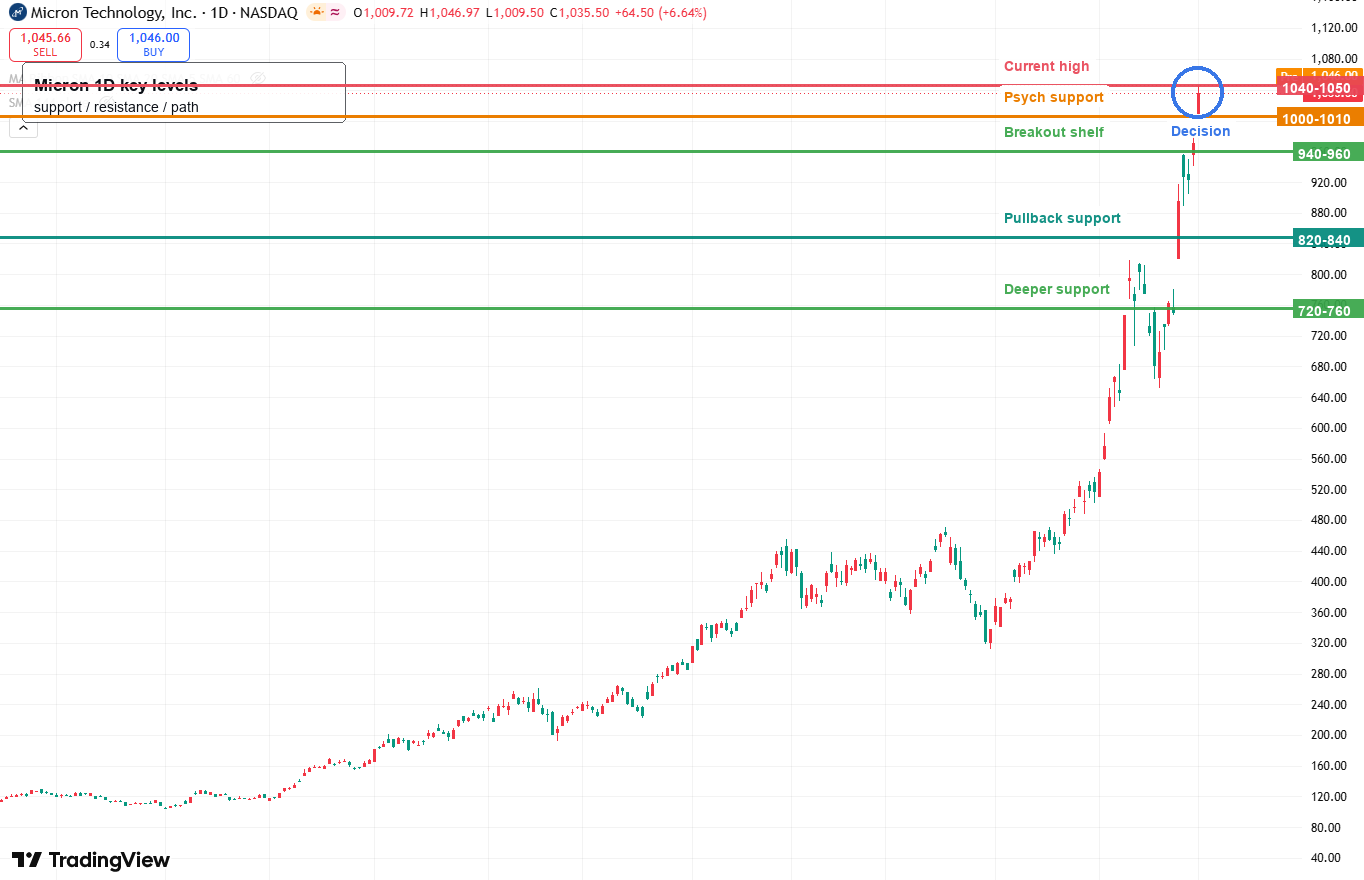
Micron Technology daily stock chart, Source: TradingView
From Micron's daily chart, the stock is currently in a very strong accelerated rally phase, with the price having reached $1,035. In the short term, focus on the $1,040-$1,050 overhead resistance and the $1,000-$1,010 psychological support; if it holds firm above $1,000 and breaks through $1,040-$1,050, it will test the $1,160 resistance level. If it falls below $1,000, it is likely to test the $940-$960 support range first, with deeper support at $820-$840 and $720-$760.
This content was translated using AI and reviewed for clarity. It is for informational purposes only.
Recommended Articles


Comments (0)
Click the $ button, enter the symbol, and select to link a stock, ETF, or other ticker.