

GBP/JPY Price Forecasts: Tests resistance at 209.60 as Yen strength wanes

- GBP/JPY extends gains from 207.57 lows to test the resistance area at 209.60.
- Weak Japanese GDP data has curbed the recent Yen strength.
- Price action shows a bullish Head & Shoulders pattern in progress.
The Pound (GBP) is trading higher against the Japanese Yen (JPY) for the second consecutive day on Monday. The pair has extended its recovery from two-month lows near 207.50 to test resistance at 209.60, which capped bulls on Thursday and Friday last week.
The Sterling is drawing some support from a weaker Yen, following downbeat Gross Domestic Product (GDP) figures in Japan. Fourth-quarter data released on Sunday revealed that the Japanese economy grew at a meagre 0.1% pace in the last three months of 2025, undershooting expectations of a 0.4% increase. Annualised figures showed a 0.2% advance, well below the 1.6% increase forecasted by the analysts.
The UK economic calendar is empty on Monday, but investors are likely to remain cautious awaiting the release of the UK’s employment data, die on Tuesday before placing large directional bets on the GBP.
Technical Analysis: Potential bullish Head & Shoulders formation
weeks'
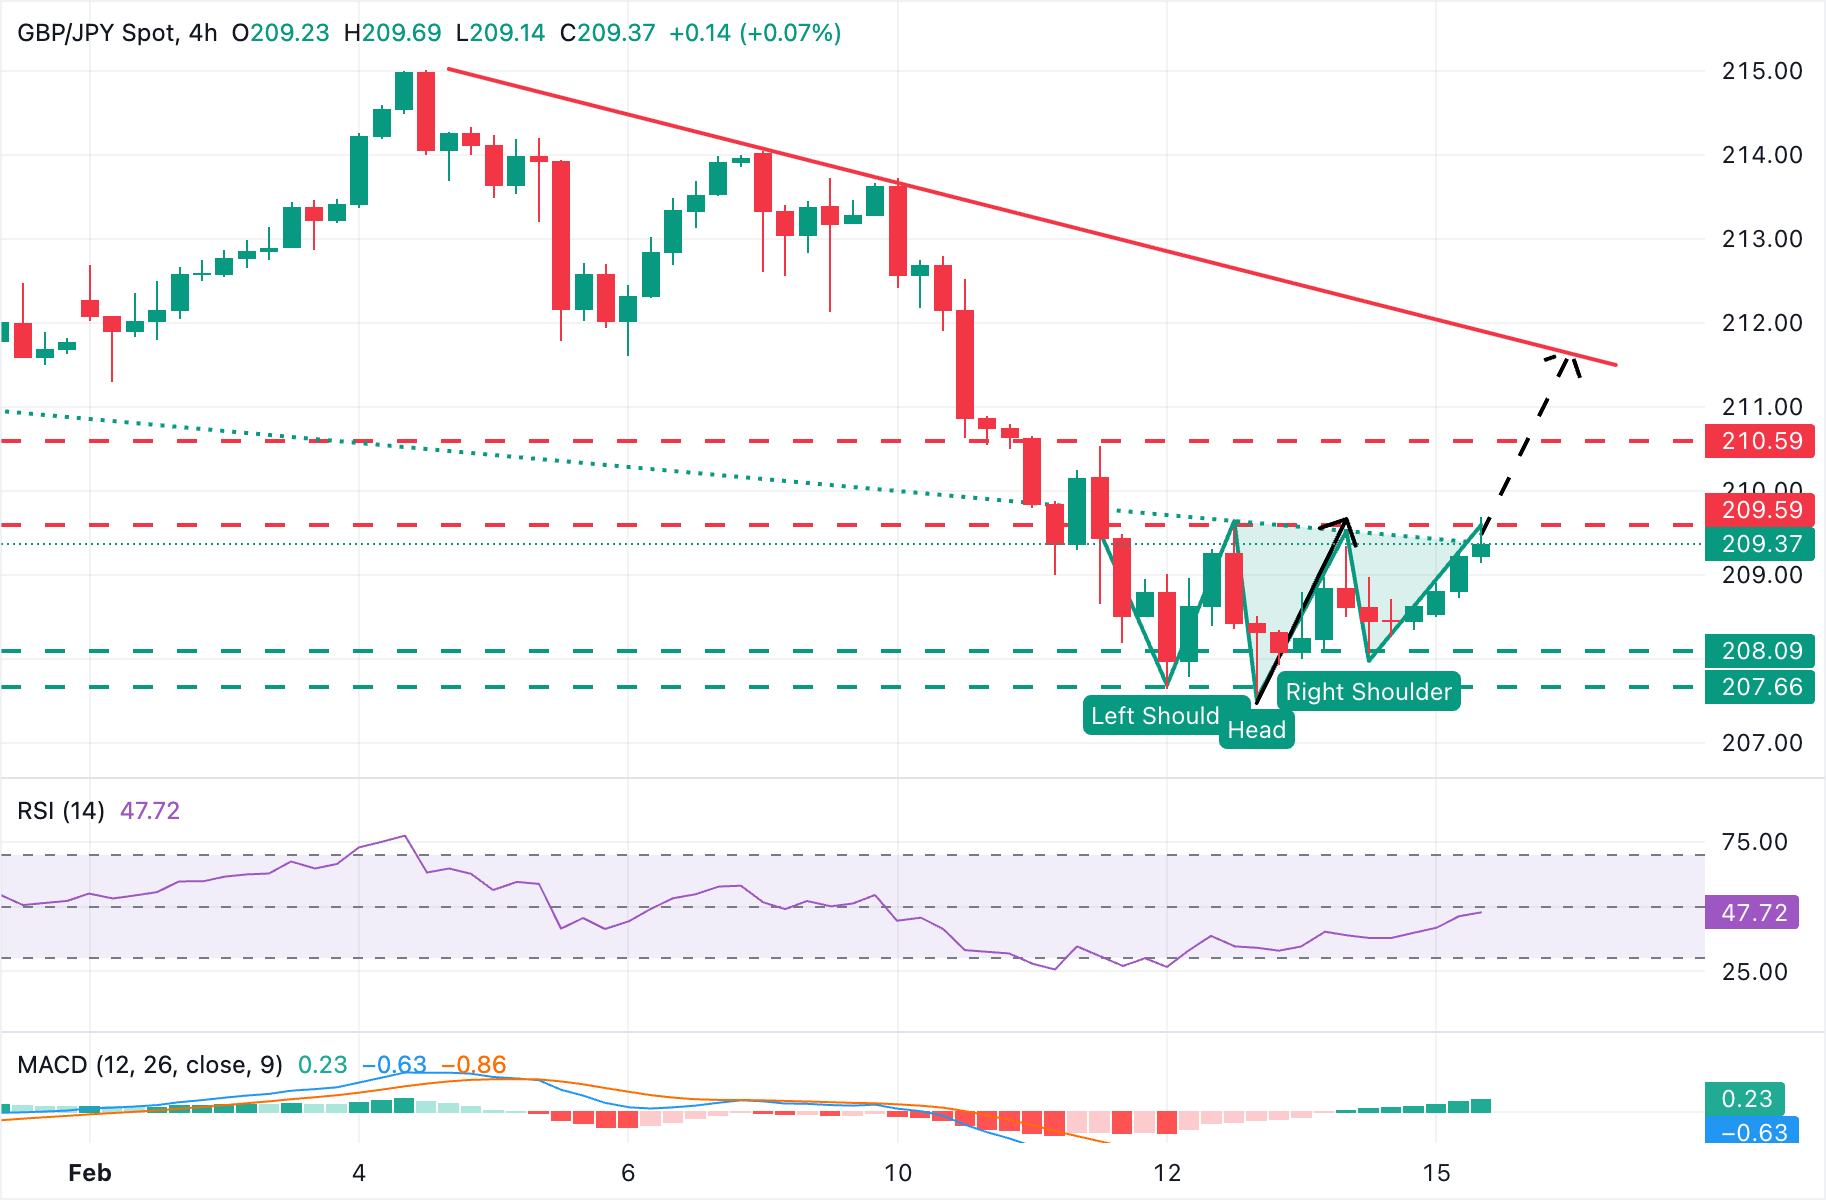
GBP/JPY is testing the 209.60 area, Thursday's high, and the neckline of a potential bullish Head & Shoulders, a pattern typically developing at the end of a cycle. In this case, it would be anticipating a bullish correction from the previous two weeks' reversal.
Technical indicators are moderately supportive. The Moving Average Convergence Divergence (MACD) line climbs above the Signal line near the zero mark. The histogram has turned positive and is widening, suggesting improving momentum. The Relative Strength Index has returned to levels near 50, hinting at stabilizing demand.
Above the mentioned 259.60, the next bullish target is the February 11 high, at 210.54. The measured target of the H&S pattern is at the descending trendline from early February highs, around 211.65. Immediate support is at Friday's low of 208.00. A bearish reversal below last week's bottom, at 207.57, would negate this view.
(The technical analysis of this story was written with the help of an AI tool.)
Japanese Yen Price Today
The table below shows the percentage change of Japanese Yen (JPY) against listed major currencies today. Japanese Yen was the strongest against the Swiss Franc.
| USD | EUR | GBP | JPY | CAD | AUD | NZD | CHF | |
|---|---|---|---|---|---|---|---|---|
| USD | 0.10% | 0.07% | 0.43% | 0.03% | -0.12% | 0.00% | 0.23% | |
| EUR | -0.10% | -0.03% | 0.35% | -0.07% | -0.22% | -0.10% | 0.13% | |
| GBP | -0.07% | 0.03% | 0.33% | -0.04% | -0.19% | -0.07% | 0.16% | |
| JPY | -0.43% | -0.35% | -0.33% | -0.40% | -0.55% | -0.43% | -0.20% | |
| CAD | -0.03% | 0.07% | 0.04% | 0.40% | -0.15% | -0.03% | 0.20% | |
| AUD | 0.12% | 0.22% | 0.19% | 0.55% | 0.15% | 0.12% | 0.35% | |
| NZD | -0.01% | 0.10% | 0.07% | 0.43% | 0.03% | -0.12% | 0.23% | |
| CHF | -0.23% | -0.13% | -0.16% | 0.20% | -0.20% | -0.35% | -0.23% |
The heat map shows percentage changes of major currencies against each other. The base currency is picked from the left column, while the quote currency is picked from the top row. For example, if you pick the Japanese Yen from the left column and move along the horizontal line to the US Dollar, the percentage change displayed in the box will represent JPY (base)/USD (quote).
Recommended Articles


Comments (0)
Click the $ button, enter the symbol, and select to link a stock, ETF, or other ticker.