

EUR/GBP Price Forecast: Euro hovers above a key support area, at 0.8645

- EUR/GBP is trapped between 0.8645 and 0.8670 within a broader bearish trend.
- The risk-averse market is likely to hold EUR and GBP bulls on Monday.
- Technically, the pair is right above the neckline of a large H&S pattern.
The Euro is showing a mild upside bias against the British Pound on Monday, but maintains its broader bearish trend intact. The pair trades at the 0.8665 area at the time of writing, but remains unable to take off from a key support area at 0.8645.
On the fundamental front, German Retail Sales beat expectations on Monday, but the impact on the Euro was minimal. The focus is now on the UK and Eurozone final Manufacturing PMIs, although the risk-averse sentiment is likely to impair both currencies and might support the sideways consolidation for the coming sessions.
Technical Analysis: At the neckline of a large Head& Shoulders pattern
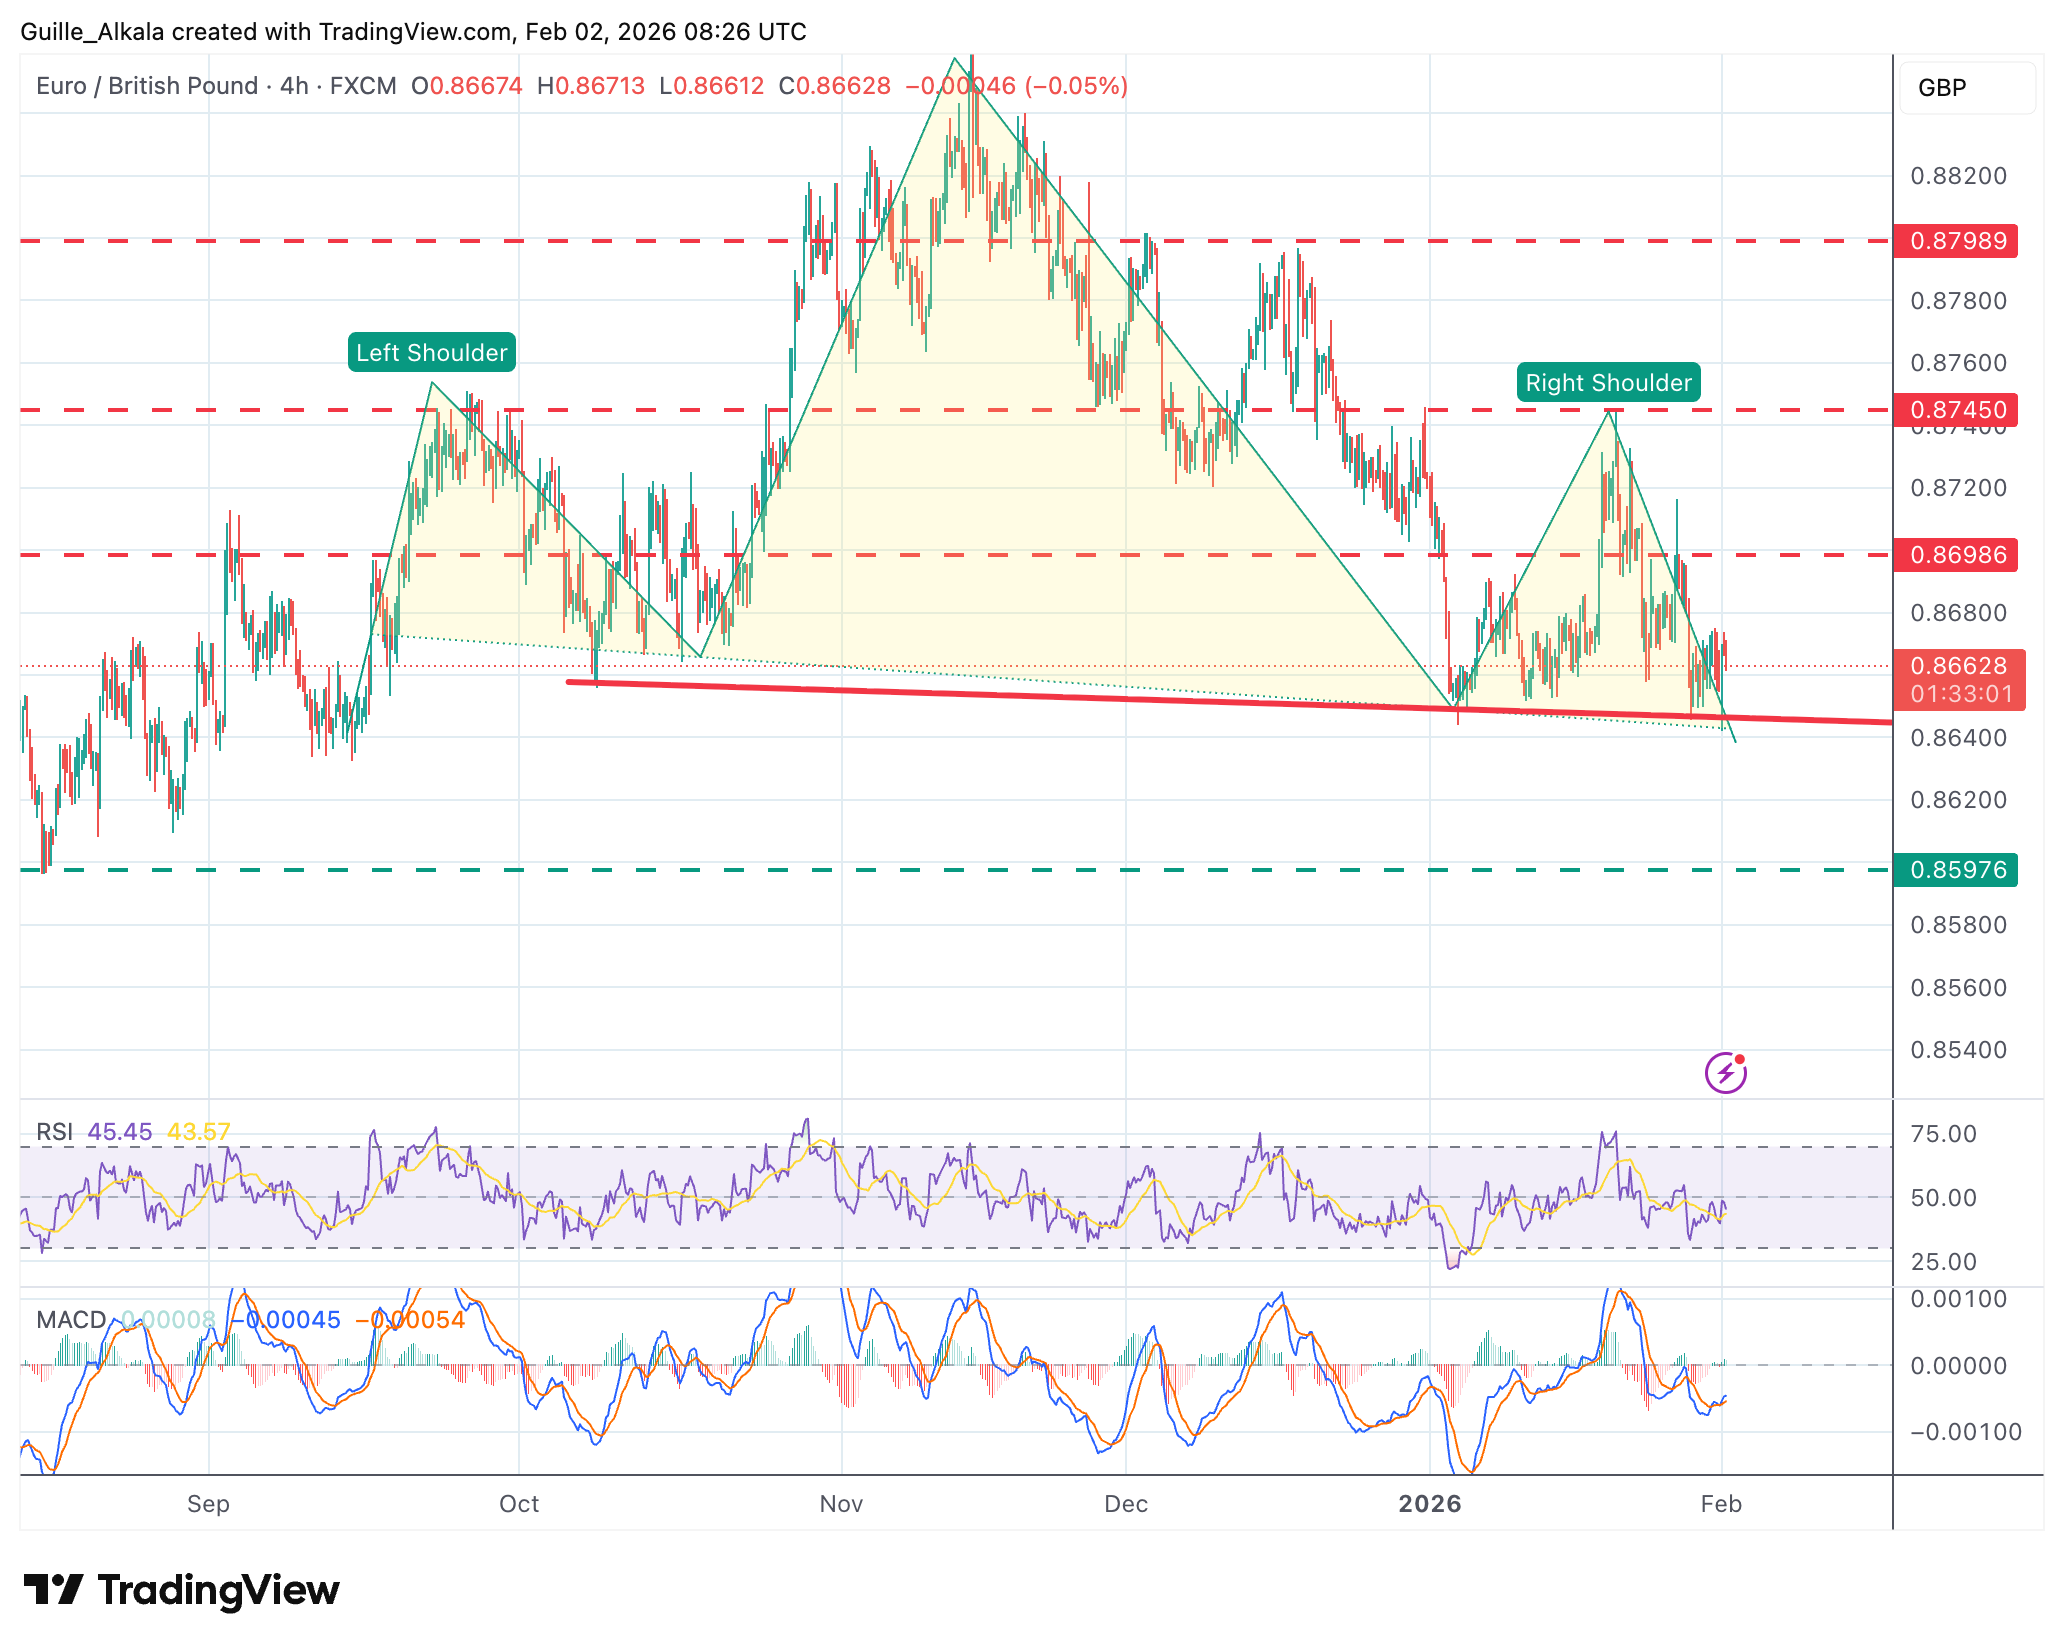
From a technical perspective, the pair is trading within a bearish channel since peaking at 0.8865 in mid-November. Indicators in the 4-hour chart, however, are mixed. The Relative Strength Index (RSI) remains below 50, highlighting the bearish momentum, but the Moving Average Convergence Divergence (MACD) line has crossed above the Signal line, which suggests that sellers might be losing steam.
Price action, however, remains dangerously close to 0.8645, the bottom of January’s trading range and the neckline of a large Head & Shoulders pattern, a bearish sign. A confirmation below here would bring July 6 and August 13 lows, at 0.8595, to the focus.
Upside attempts, on the other hand, remain capped below the 0.8675 area on Monday, ahead of the January 28 high, near 0.8700, and the January 21 high, at 0.8745.
Euro Price Today
The table below shows the percentage change of Euro (EUR) against listed major currencies today. Euro was the strongest against the Japanese Yen.
| USD | EUR | GBP | JPY | CAD | AUD | NZD | CHF | |
|---|---|---|---|---|---|---|---|---|
| USD | -0.05% | -0.05% | 0.19% | 0.17% | 0.17% | 0.10% | 0.08% | |
| EUR | 0.05% | 0.00% | 0.22% | 0.22% | 0.21% | 0.14% | 0.12% | |
| GBP | 0.05% | -0.00% | 0.21% | 0.22% | 0.22% | 0.14% | 0.13% | |
| JPY | -0.19% | -0.22% | -0.21% | 0.00% | 0.00% | -0.06% | -0.08% | |
| CAD | -0.17% | -0.22% | -0.22% | -0.01% | 0.00% | -0.07% | -0.09% | |
| AUD | -0.17% | -0.21% | -0.22% | -0.01% | -0.00% | -0.07% | -0.09% | |
| NZD | -0.10% | -0.14% | -0.14% | 0.06% | 0.07% | 0.07% | -0.02% | |
| CHF | -0.08% | -0.12% | -0.13% | 0.08% | 0.09% | 0.09% | 0.02% |
The heat map shows percentage changes of major currencies against each other. The base currency is picked from the left column, while the quote currency is picked from the top row. For example, if you pick the Euro from the left column and move along the horizontal line to the US Dollar, the percentage change displayed in the box will represent EUR (base)/USD (quote).
Recommended Articles


Comments (0)
Click the $ button, enter the symbol, and select to link a stock, ETF, or other ticker.