

USD/INR remains stronger despite India–EU free trade agreement

- The Indian Rupee remains under pressure as traders adopt caution ahead of the Fed policy due on Wednesday.
- The INR weakened as equity outflows accelerated and importer hedging outweighed exporters amid depreciation expectations.
- Indian markets may find support from a potential India–EU trade deal, boosting pharma, textiles, and chemicals exports.
The USD/INR pair continues its winning streak that began on January 15, maintaining its position near an all-time high of 91.96, reached on January 23. The Indian Rupee (INR) could stay under pressure against the US Dollar (USD) as traders remain cautious ahead of the Federal Reserve’s (Fed) policy decision on Wednesday. While rates are expected to remain unchanged, markets will scrutinize the Fed’s statement and Chair Jerome Powell’s press conference for clues on the timing of future rate cuts.
The Indian Rupee came under pressure as equity outflows accelerated last week and importer hedging outweighed exporter activity amid growing depreciation expectations. However, a potential India–European Union (EU) free trade agreement this week could provide a counter-cyclical buffer by boosting exports in pharma, textiles, and chemicals, while improving regulatory clarity and attracting foreign inflows, helping limit downside risks to the Rupee.
The USD/INR pair may find early support from mildly positive US and Asian market sentiment, along with near-term optimism sparked by remarks from the US administration on possible tariff rollbacks. The US could remove the 25% punitive tariffs imposed on India in mid-2025 for purchasing Russian oil, following comments by US Treasury Secretary Scott Bessent on the sidelines of the World Economic Forum in Davos last week, which fueled speculation about easing trade tensions.
RBI’s INR 1 lakh crore liquidity infusion via government bond purchases is expected to stabilize funding conditions. With the Union Budget and clarity on US–India trade timelines pending, markets are likely to stay cautious, according to Reuters.
US Dollar stays pressured amid rising political uncertainty, shutdown risks
- The US Dollar Index (DXY), which measures the value of the US Dollar against six major currencies, is remaining subdued and trading near 97.00 at the time of writing. The Greenback remains under pressure from rising political uncertainty, with the US government heading toward a potential partial shutdown.
- Senate Democratic leader Chuck Schumer has vowed to oppose a funding package that includes appropriations for the Department of Homeland Security, leaving Congress facing a January 30 deadline to avert a shutdown.
- Traders may also turn cautious amid uncertainty surrounding the Federal Reserve (Fed). US President Donald Trump said last week he would soon announce his nominee to replace Fed Chair Jerome Powell, fueling speculation that the next chair could favor faster interest rate cuts.
- Trump warned he would impose 100% tariffs on Canadian goods if Ottawa were to strike a trade deal with China, the BBC reported over the weekend. In response, Canada’s Prime Minister Mark Carney said on Sunday that Canada has no plans to pursue a free trade agreement with China, clarifying that his recent understanding with Beijing only reduced tariffs in a few sectors that had been hit recently.
- US President Donald Trump said he would step back from imposing tariffs on goods from European nations opposing his effort to take possession of Greenland. He said earlier there is “no going back” on his ambitions regarding Greenland, alongside earlier threats to impose new 10% tariffs on eight European Union (EU) countries.
- The US Gross Domestic Product grew at an annualized rate of 4.4% in the third quarter of 2025, slightly more than expected and the previous reading of 4.3%. Additionally, the Initial Jobless Claims came in at 200K last week, below the market consensus of 212K.
- US Personal Consumption Expenditures (PCE) Price Index rose to 2.8% year-over-year in November from 2.7% in October. On a monthly basis, the PCE Price Index rose by 0.2%. The annual core PCE Price Index, the Federal Reserve's (Fed) preferred gauge of inflation, rose by 2.8% in November, following the 2.7% increase recorded in October and matching the market expectation.
- Fed officials have signaled little urgency to ease policy further until there is clearer evidence that inflation is sustainably moving toward the 2% target. Morgan Stanley analysts revised their 2026 outlook, now forecasting one rate cut in June followed by another in September, compared with their previous expectation of cuts in January and April.
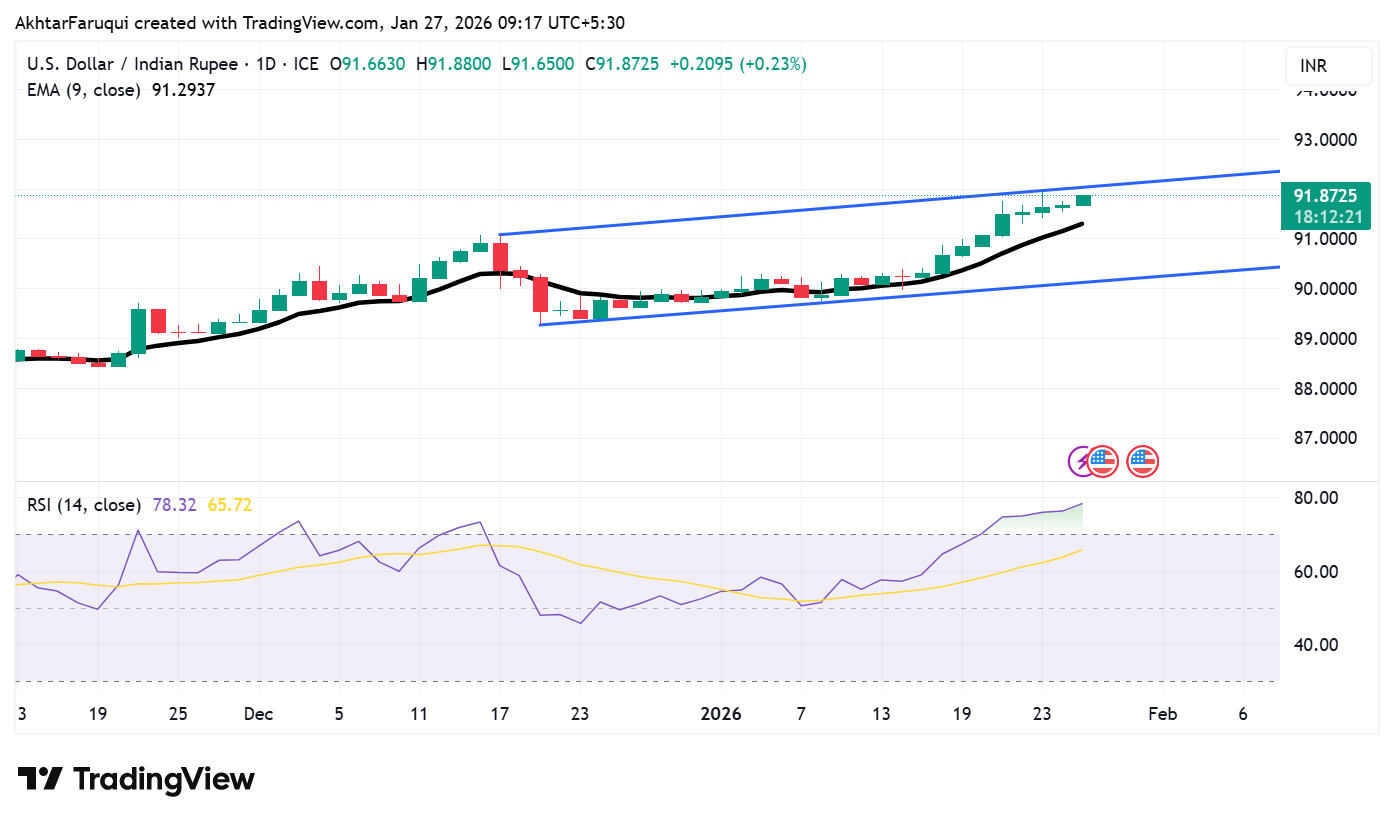
Technical Analysis: USD/INR remains close to record highs near 92.00
USD/INR is trading around 91.80 at the time of writing. The technical analysis of the daily chart suggests a persistent bullish bias as the pair is rising within the ascending channel pattern. However, the 14-day Relative Strength Index (RSI) at 78 suggests the asset is overbought, signaling stretched momentum and an increased risk of a near-term pullback or consolidation.
The immediate resistance lies at the all-time high of 91.96, recorded on January 23, followed by the upper boundary of the ascending channel around 92.10. On the downside, the nine-day Exponential Moving Average (EMA) at 91.28 could act as the primary support. A break below the short-term average would expose the area around the lower ascending channel at 90.20.
US Dollar Price Today
The table below shows the percentage change of US Dollar (USD) against listed major currencies today. US Dollar was the strongest against the Japanese Yen.
| USD | EUR | GBP | JPY | CAD | AUD | NZD | INR | |
|---|---|---|---|---|---|---|---|---|
| USD | 0.01% | -0.02% | 0.20% | 0.08% | 0.07% | 0.16% | 0.16% | |
| EUR | -0.01% | -0.03% | 0.22% | 0.07% | 0.06% | 0.15% | 0.15% | |
| GBP | 0.02% | 0.03% | 0.25% | 0.10% | 0.09% | 0.18% | 0.18% | |
| JPY | -0.20% | -0.22% | -0.25% | -0.13% | -0.15% | -0.06% | -0.07% | |
| CAD | -0.08% | -0.07% | -0.10% | 0.13% | -0.01% | 0.08% | 0.10% | |
| AUD | -0.07% | -0.06% | -0.09% | 0.15% | 0.01% | 0.09% | 0.11% | |
| NZD | -0.16% | -0.15% | -0.18% | 0.06% | -0.08% | -0.09% | 0.02% | |
| INR | -0.16% | -0.15% | -0.18% | 0.07% | -0.10% | -0.11% | -0.02% |
The heat map shows percentage changes of major currencies against each other. The base currency is picked from the left column, while the quote currency is picked from the top row. For example, if you pick the US Dollar from the left column and move along the horizontal line to the Japanese Yen, the percentage change displayed in the box will represent USD (base)/JPY (quote).
Indian economy FAQs
The Indian economy has averaged a growth rate of 6.13% between 2006 and 2023, which makes it one of the fastest growing in the world. India’s high growth has attracted a lot of foreign investment. This includes Foreign Direct Investment (FDI) into physical projects and Foreign Indirect Investment (FII) by foreign funds into Indian financial markets. The greater the level of investment, the higher the demand for the Rupee (INR). Fluctuations in Dollar-demand from Indian importers also impact INR.
India has to import a great deal of its Oil and gasoline so the price of Oil can have a direct impact on the Rupee. Oil is mostly traded in US Dollars (USD) on international markets so if the price of Oil rises, aggregate demand for USD increases and Indian importers have to sell more Rupees to meet that demand, which is depreciative for the Rupee.
Inflation has a complex effect on the Rupee. Ultimately it indicates an increase in money supply which reduces the Rupee’s overall value. Yet if it rises above the Reserve Bank of India’s (RBI) 4% target, the RBI will raise interest rates to bring it down by reducing credit. Higher interest rates, especially real rates (the difference between interest rates and inflation) strengthen the Rupee. They make India a more profitable place for international investors to park their money. A fall in inflation can be supportive of the Rupee. At the same time lower interest rates can have a depreciatory effect on the Rupee.
India has run a trade deficit for most of its recent history, indicating its imports outweigh its exports. Since the majority of international trade takes place in US Dollars, there are times – due to seasonal demand or order glut – where the high volume of imports leads to significant US Dollar- demand. During these periods the Rupee can weaken as it is heavily sold to meet the demand for Dollars. When markets experience increased volatility, the demand for US Dollars can also shoot up with a similarly negative effect on the Rupee.
Recommended Articles


Comments (0)
Click the $ button, enter the symbol, and select to link a stock, ETF, or other ticker.