

GBP/USD slides toward 1.3370 as strong US data powers US Dollar rally

- GBP/USD drops over 0.5% as US jobless claims and factory surveys beat expectations.
- DXY hits new yearly highs as markets trim Fed easing bets for later this year.
- UK GDP beats forecasts, but does not alter BoE rate-cut expectations.
The British Pound loses ground against the Greenback on Thursday as solid economic data in the US, trump an upbeat Gross Domestic Product (GDP) report in the UK. At the time of writing, the GBP/USD trades at 1.3367, down 0.53%.
Sterling weakens despite upbeat UK GDP as robust US jobs and manufacturing data lift the Greenback
Investors’ mood improved on Thursday due to a strong Initial Jobless Claims report for the week ending January 10. The print was below the 215K projected, at 198K, well below the prior’s number of 207K. At the same time, the New York Empire State Manufacturing Index for January improved from -3.7 to 7.7. Meanwhile the Philadelphia Fed Manufacturing Survey for the same period exceeded estimates of -2, jumped sharply by 12.9.
The Greenback staged a rally after the data release, surging to a new yearly high as depicted by the US Dollar Index (DXY). The DXY which tracks the American currency performance versus six peers, is up 0.33% at 99.38.
Worth noting that money markets had priced in less easing by the Fed, with investors trimming the odds from 52 to 48.5 basis points of easing towards the year’s end.
Recently, Fed officials Raphael Bostic and Austan Goolsbee crossed thew wires. Bostic said that he expects the economy to grow above 2% though expects inflationary pressures to continue and the Fed needs to be restrictive. Goolsbee said that the was not surprised by jobless claims data, reiterating that the most important thing is getting inflation back to 2%.
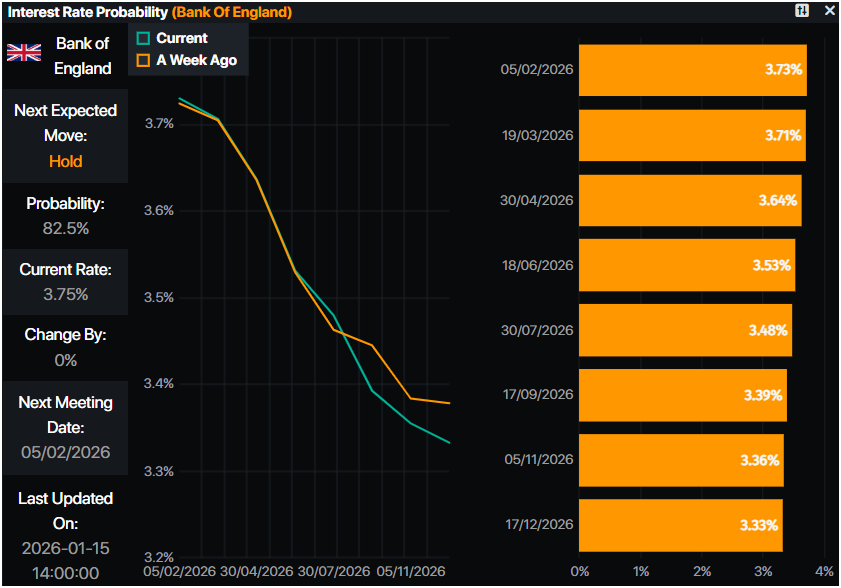
In the UK, the economy grew above estimates in November, but it didn’t move the needle, regarding rate cut expectation of the Bank of England (BoE). GDP in November expanded by 0.3% MoM, following October’s 0.1% contraction, official data showed on Thursday.
The swaps market had priced in 42 basis points of easing for the Bank of England, towards the end of 2026, revealed Prime Market Terminal data.
What’s in the calendar for January 16?
The UK docket is empty, but in the US, traders would eye Industrial Production and speeches by Fed Governors Michelle Bowman and Philip Jefferson.
GBP/USD Price Forecast: Technical outlook
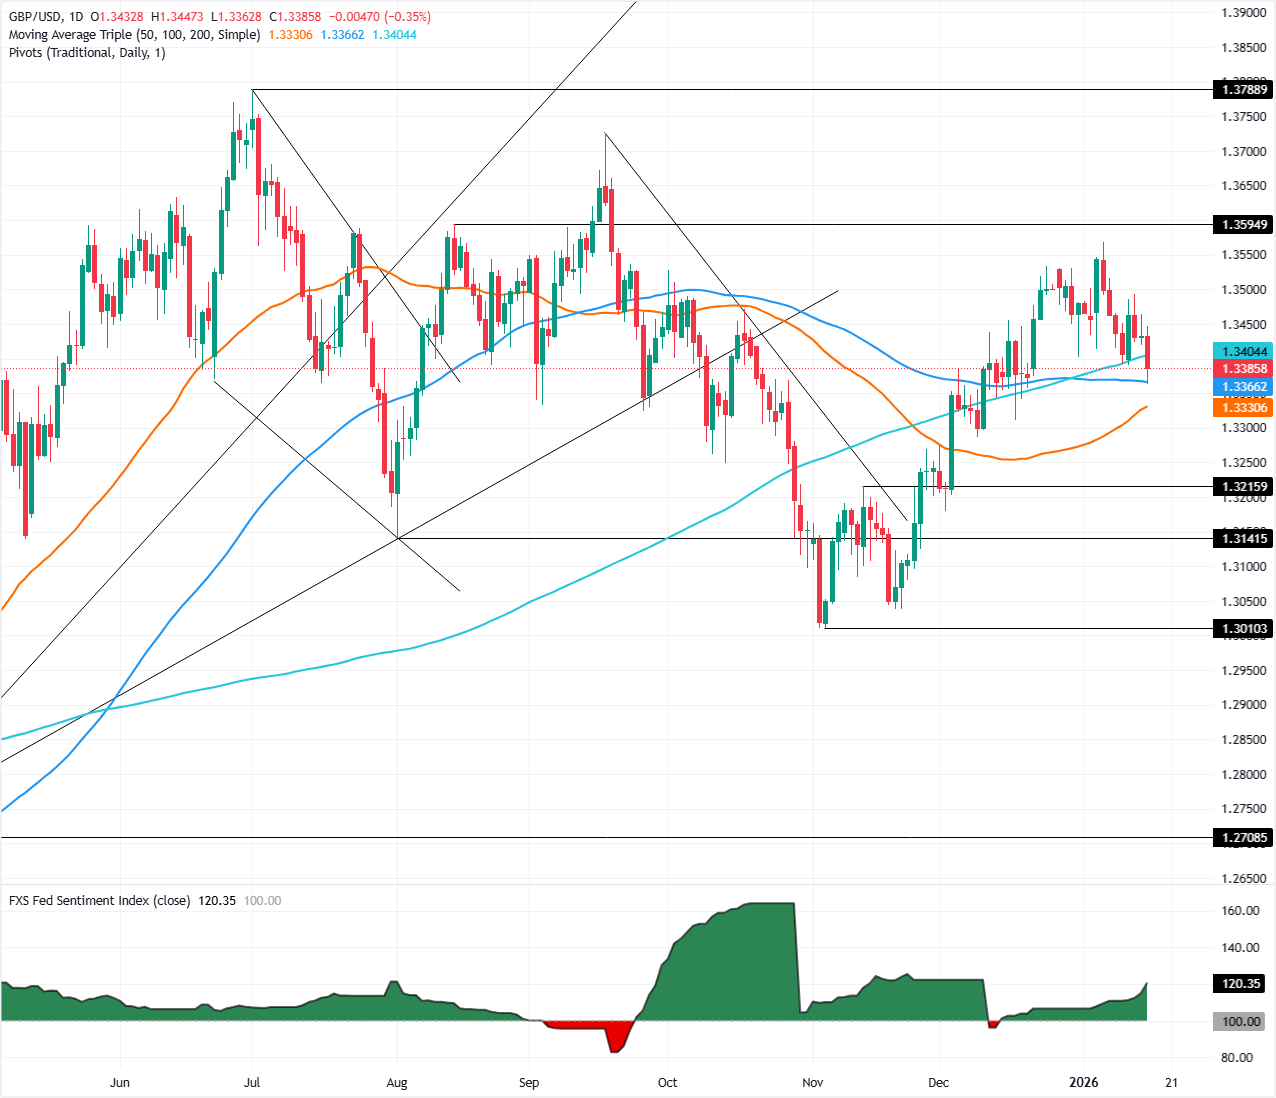
The technical picture shows the GBP/USD crossed below the 200-day Simple Moving Average (SMA) at 1.3395, clearing the path for lower prices, with sellers eyeing the 50-day SMA at 1.3313. Once those levels are taken out, up next is 1.3300.
The Relative Strength Index (RSI) favors sellers as it remains below its neutral level. Hence, the path of least resistance is downwards.
On the other hand, the GBP/USD first resistance would be the 200-day SMA ahead of 1.3400. A breach of the latter will expose the 20-day SMA at 1.3451 ahead of 1.3500.
Pound Sterling Price This week
The table below shows the percentage change of British Pound (GBP) against listed major currencies this week. British Pound was the strongest against the Swiss Franc.
| USD | EUR | GBP | JPY | CAD | AUD | NZD | CHF | |
|---|---|---|---|---|---|---|---|---|
| USD | 0.25% | 0.09% | 0.24% | -0.14% | -0.32% | -0.21% | 0.31% | |
| EUR | -0.25% | -0.17% | 0.06% | -0.39% | -0.58% | -0.46% | 0.06% | |
| GBP | -0.09% | 0.17% | 0.21% | -0.22% | -0.40% | -0.29% | 0.23% | |
| JPY | -0.24% | -0.06% | -0.21% | -0.42% | -0.59% | -0.48% | 0.05% | |
| CAD | 0.14% | 0.39% | 0.22% | 0.42% | -0.19% | -0.06% | 0.46% | |
| AUD | 0.32% | 0.58% | 0.40% | 0.59% | 0.19% | 0.10% | 0.63% | |
| NZD | 0.21% | 0.46% | 0.29% | 0.48% | 0.06% | -0.10% | 0.51% | |
| CHF | -0.31% | -0.06% | -0.23% | -0.05% | -0.46% | -0.63% | -0.51% |
The heat map shows percentage changes of major currencies against each other. The base currency is picked from the left column, while the quote currency is picked from the top row. For example, if you pick the British Pound from the left column and move along the horizontal line to the US Dollar, the percentage change displayed in the box will represent GBP (base)/USD (quote).
Recommended Articles


Comments (0)
Click the $ button, enter the symbol, and select to link a stock, ETF, or other ticker.