

EUR/USD hovers near recent lows ahead of Eurozone PMIs

- The Euro remains trading sideways between 1.1620 and 1.1580 against the US Dollar.
- Eurozone HCOB PMI figures are expected to show a slightly weaker business activity in October.
- US yearly CPI is seen accelerating beyond the 3% threshold in September.
EUR/USD shows moderate losses on Friday, trading a few pips above 1.1600 at the time of writing, on track for a 0.4% weekly decline. The pair remains hovering within recent ranges, with traders awaiting the Eurozone preliminary HCOB Purchasing Managers' Indexes (PMIs) for October and the US Consumer Price Index (CPI) release, due later on the day.
The common currency has remained on the back foot this week as US President Donald Trump soured market sentiment, threatening new restrictions on software exports to China on Thursday, ahead of next week's meeting with Chinese President Xi Jinping.
Trade issues remain in the spotlight on Friday, as President Trump revived frictions, this time with Canada, publishing a post on social media assuring that trade negotiations with his northern neighbour have "terminated", apparently due to an advert that featured former US president Ronald Reagan speaking negatively about tariffs.
The focus now shifts to the Eurozone's preliminary business activity figures, which are expected to show a moderate slowdown and, above all, the US CPI, the first key economic release since the US government shutdown began, already four weeks ago. US inflation is expected to have accelerated in September, though it is highly unlikely to alter expectations that the Federal Reserve (Fed) will cut rates by 25 basis points next week.
Euro Price Today
The table below shows the percentage change of Euro (EUR) against listed major currencies today. Euro was the strongest against the Japanese Yen.
| USD | EUR | GBP | JPY | CAD | AUD | NZD | CHF | |
|---|---|---|---|---|---|---|---|---|
| USD | 0.10% | 0.06% | 0.23% | 0.16% | 0.22% | 0.12% | 0.12% | |
| EUR | -0.10% | -0.03% | 0.14% | 0.07% | 0.12% | 0.02% | 0.02% | |
| GBP | -0.06% | 0.03% | 0.16% | 0.10% | 0.16% | 0.05% | 0.04% | |
| JPY | -0.23% | -0.14% | -0.16% | -0.06% | -0.00% | -0.11% | -0.12% | |
| CAD | -0.16% | -0.07% | -0.10% | 0.06% | 0.05% | -0.05% | -0.07% | |
| AUD | -0.22% | -0.12% | -0.16% | 0.00% | -0.05% | -0.10% | -0.12% | |
| NZD | -0.12% | -0.02% | -0.05% | 0.11% | 0.05% | 0.10% | -0.02% | |
| CHF | -0.12% | -0.02% | -0.04% | 0.12% | 0.07% | 0.12% | 0.02% |
The heat map shows percentage changes of major currencies against each other. The base currency is picked from the left column, while the quote currency is picked from the top row. For example, if you pick the Euro from the left column and move along the horizontal line to the US Dollar, the percentage change displayed in the box will represent EUR (base)/USD (quote).
Daily digest market movers: Majors remain in range ahead of key data
- The US Dollar (USD) is moving within recent ranges, on track for a moderate weekly advance as fresh trade woes have kept risk appetite subdued this week. Investors are awaiting US inflation data release due later on Friday, although the main focus remains on the Trump-Xi meeting and the Fed's monetary policy decision next week.
- In Europe, October's preliminary Manufacturing PMI is expected to show a slightly deeper contraction, to 49.5 from September's 49.8 reading. Likewise, the Services activity is forecasted to have slowed down to 51.1 from 51.3 in the previous month.
- Later on the day, the US Bureau of Labour Statistics will release September CPI, which is expected to have risen at a steady 0.4% pace in the month, and 3.1% year-on-year, up from August's 2.9% reading., The core CPI, however, is seen growing at the same pace as in the previous month, at a 3.1% yearly rate.
- These figures will frame next week's Fed decision, although investors are practically fully pricing a quarter-point rate cut. The CME Group's Fed Watch tool shows a 98.9% chance that the central bank will trim its benchmark interest rate by 25 basis points on Wednesday and a 91% chance of another such cut in December.
Technical Analysis: EUR/USD treads water around 1.1600
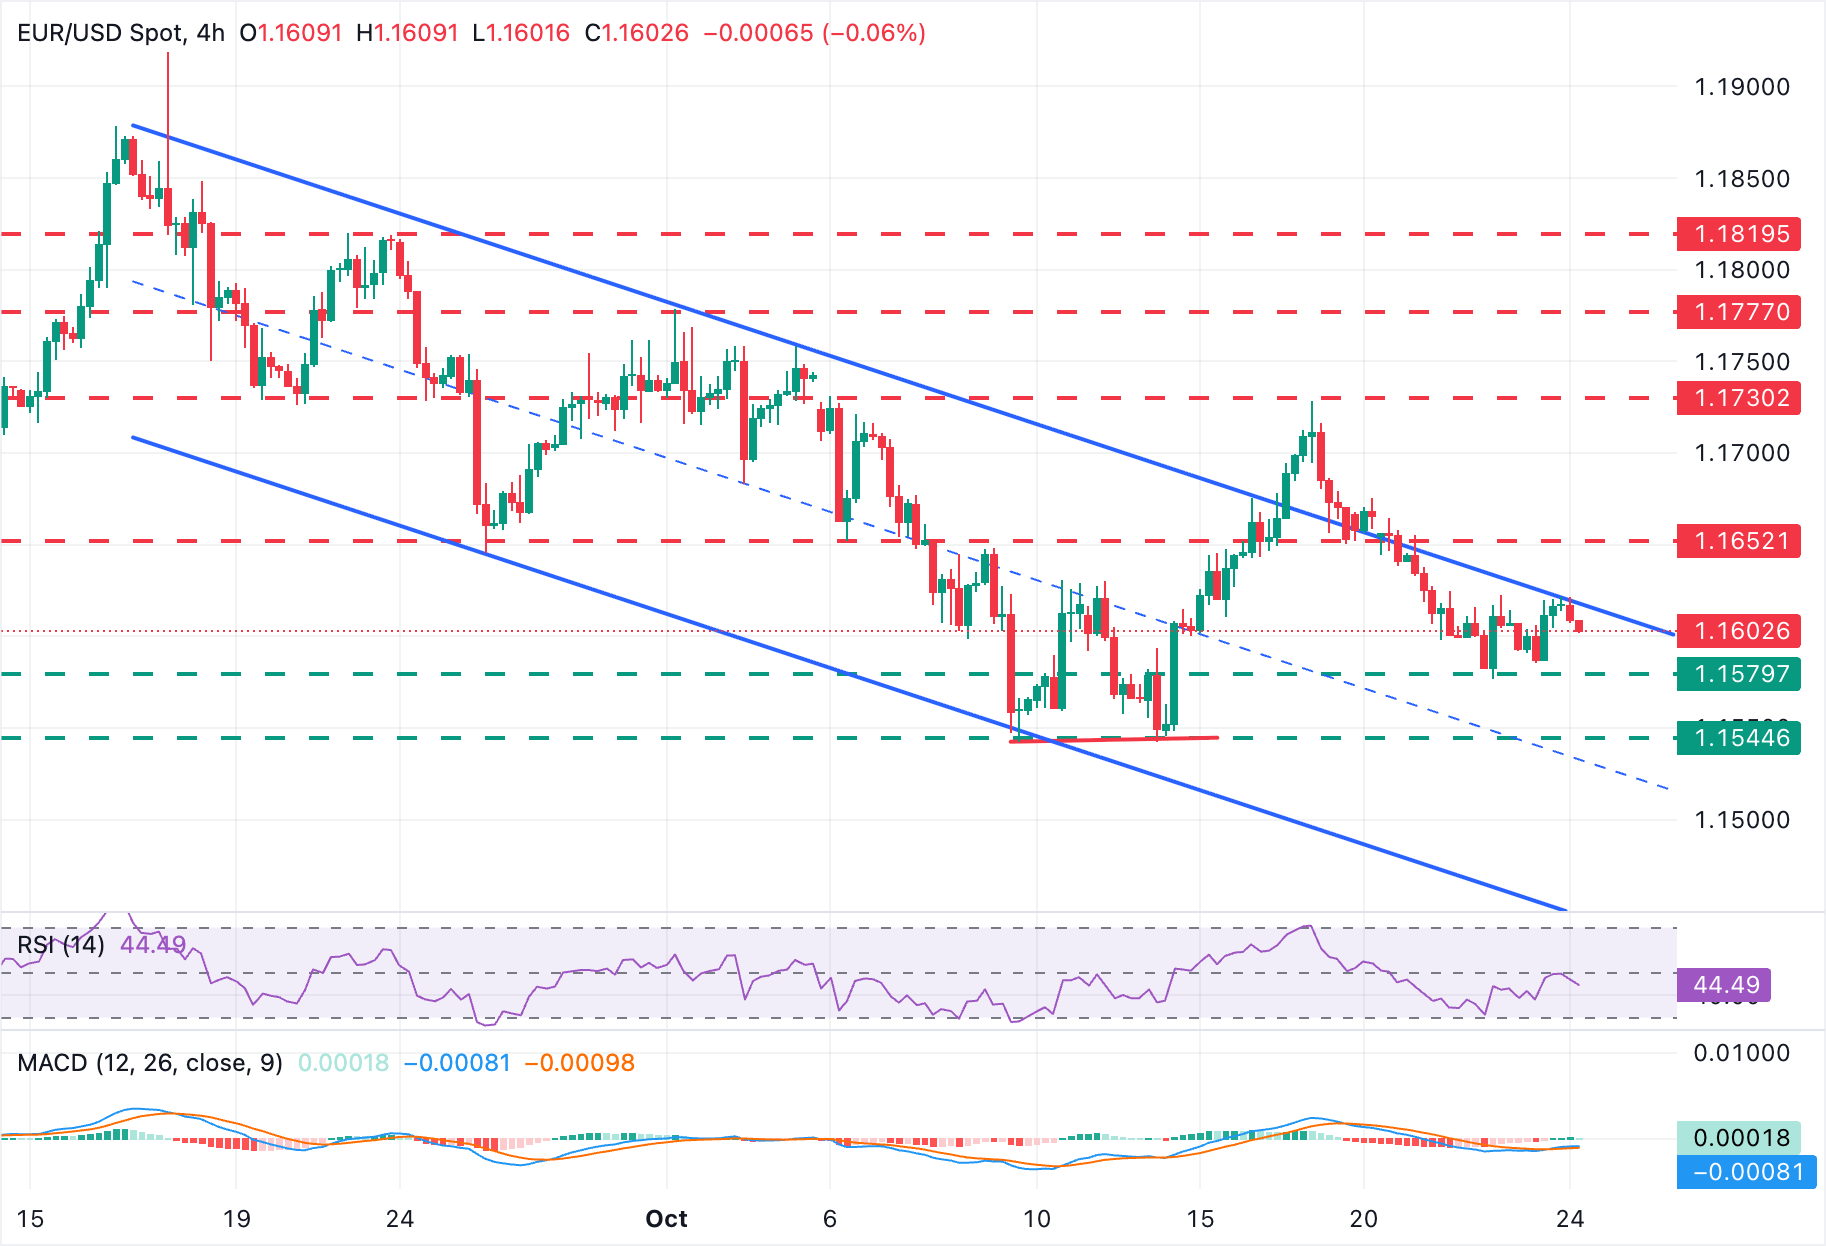
EUR/USD remains trading within a descending channel, with rallies finding sellers. Recent price action has remained trapped within a narrow range between 1.1620 and the support area at 1.1580, with investors looking for fundamental drivers to determine the pair's near-term direction.
Technical indicators are pointing lower on the 4-hour chart, with the Relative Strength Index (RSI) unable to regain the 50 level. Bears, however, would need to confirm below the mentioned 1.1580 support to clear the way towards the October 9 and 14 lows, in the area of 1.1545. Further down, the 1.1500 round level appears as a potential target ahead of the channel bottom, now around 1.1450.
Bullish attempts have remained capped below 1.1620, where Thursday's high meets the channel top. A successful breach of this level would shift the focus towards the October 21 high, around 1.1650, ahead of the October 17 high, at 1.1728.
Economic Indicator
HCOB Manufacturing PMI
The Manufacturing Purchasing Managers Index (PMI), released on a monthly basis by S&P Global and Hamburg Commercial Bank (HCOB), is a leading indicator gauging business activity in the Eurozone manufacturing sector. The data is derived from surveys of senior executives at private-sector companies from the manufacturing sector. Survey responses reflect the change, if any, in the current month compared to the previous month and can anticipate changing trends in official data series such as Gross Domestic Product (GDP), industrial production, employment and inflation. The index varies between 0 and 100, with levels of 50.0 signaling no change over the previous month. A reading above 50 indicates that the manufacturing economy is generally expanding, a bullish sign for the Euro (EUR). Meanwhile, a reading below 50 signals that activity among goods producers is generally declining, which is seen as bearish for EUR.
Next release: Fri Oct 24, 2025 08:00 (Prel)
Frequency: Monthly
Consensus: 49.5
Previous: 49.8
Source: S&P Global
Economic Indicator
HCOB Services PMI
The Services Purchasing Managers Index (PMI), released on a monthly basis by S&P Global and Hamburg Commercial Bank (HCOB), is a leading indicator gauging business activity in the Eurozone services sector. As the services sector dominates a large part of the economy, the Services PMI is an important indicator gauging the state of overall economic conditions. The data is derived from surveys of senior executives at private-sector companies from the services sector. Survey responses reflect the change, if any, in the current month compared to the previous month and can anticipate changing trends in official data series such as Gross Domestic Product (GDP), industrial production, employment and inflation. The index varies between 0 and 100, with levels of 50.0 signaling no change over the previous month. A reading above 50 indicates that the services economy is generally expanding, a bullish sign for the Euro (EUR). Meanwhile, a reading below 50 signals that activity among services providers is generally declining, which is seen as bearish for EUR.
Next release: Fri Oct 24, 2025 08:00 (Prel)
Frequency: Monthly
Consensus: 51.1
Previous: 51.3
Source: S&P Global
Recommended Articles


Comments (0)
Click the $ button, enter the symbol, and select to link a stock, ETF, or other ticker.