

Pound Sterling strengthens as UK employment data meets estimates

- The Pound Sterling gains sharply against its major peers after the release of the UK employment data.
- The UK ILO Unemployment Rate came in steady at 4.7%, as expected.
- Investors expect the Fed to cut interest rates on Wednesday.
The Pound Sterling (GBP) attracts bids against its major peers on Tuesday, reaching its highest level in more than two months against the US Dollar, after the release of the United Kingdom (UK) labor market data for the three months ending July. The Office for National Statistics (ONS) reported that the Unemployment Rate remained steady at a four-year high of 4.7%, as economists had expected.
The UK economy created fresh 232K jobs in the quarter ending July, very close to estimates of 220K and the prior reading of 239K. Meanwhile, Average Earnings excluding bonuses, a key measure of wage growth, rose at an annual pace of 4.8%, as expected, slower than the previous 5%. Average Earnings including bonuses, a closely tracked indicator by the Bank of England, also rose in line with expectations at 4.7%, higher than the previous reading of 4.6%.
Steady employment conditions are expected to offer relief to Bank of England (BoE) officials, who had warned of growing labor market concerns. BoE Governor Andrew Bailey said earlier this month that he is “more concerned about downside job risks” than other Monetary Policy Committee (MPC) members who voted to keep rates on hold in the August monetary policy meeting.
Investors brace for more volatility in the British currency this week as the Consumer Price Index (CPI) data for August and the BoE’s monetary policy announcement are scheduled for Wednesday and Thursday, respectively.
The UK CPI report is expected to show that the headline inflation rose to 3.9% on an annual basis from 3.8%. Signs of inflationary pressures accelerating would boost hopes that the BoE will keep interest rates on hold at 4% on Thursday.
Pound Sterling Price Today
The table below shows the percentage change of British Pound (GBP) against listed major currencies today. British Pound was the strongest against the Australian Dollar.
| USD | EUR | GBP | JPY | CAD | AUD | NZD | CHF | |
|---|---|---|---|---|---|---|---|---|
| USD | -0.31% | -0.23% | -0.21% | -0.03% | 0.05% | 0.07% | -0.31% | |
| EUR | 0.31% | 0.06% | -0.03% | 0.25% | 0.39% | 0.34% | 0.00% | |
| GBP | 0.23% | -0.06% | -0.06% | 0.20% | 0.34% | 0.29% | -0.07% | |
| JPY | 0.21% | 0.03% | 0.06% | 0.25% | 0.33% | 0.10% | -0.03% | |
| CAD | 0.03% | -0.25% | -0.20% | -0.25% | 0.08% | 0.05% | -0.26% | |
| AUD | -0.05% | -0.39% | -0.34% | -0.33% | -0.08% | 0.04% | -0.38% | |
| NZD | -0.07% | -0.34% | -0.29% | -0.10% | -0.05% | -0.04% | -0.31% | |
| CHF | 0.31% | -0.00% | 0.07% | 0.03% | 0.26% | 0.38% | 0.31% |
The heat map shows percentage changes of major currencies against each other. The base currency is picked from the left column, while the quote currency is picked from the top row. For example, if you pick the British Pound from the left column and move along the horizontal line to the US Dollar, the percentage change displayed in the box will represent GBP (base)/USD (quote).
Daily digest market movers: Fed dovish bets weigh on US Dollar
- The Pound Sterling jumps to near 1.3650 against the US Dollar (USD) during Tuesday’s European session after the release of the UK employment data. The strength in the GBP/USD pair is also driven by weakness in the US Dollar.
- During the press time, the US Dollar Index (DXY), which tracks the Greenback’s value against six major currencies, revisits a seven-week low near 97.00.
- The US Dollar faces selling pressure as traders are increasingly confident that the Federal Reserve (Fed) will cut interest rates on Wednesday. According to the CME FedWatch tool, there is a 96% chance that the Fed will reduce interest rates by 25 basis points (bps) to 4.00%-4.25%, while the rest support a bigger reduction of 50 bps.
- The reasoning behind firm Fed dovish speculation is growing downside United States (US) labor market risks . Lately, a majority of Federal Open Market Committee (FOMC) members, including Chair Jerome Powell, argued in favor of monetary policy expansion amidst slowing job demand.
- On Wednesday, investors will pay close attention to the monetary policy statement, the dot plot and Powell’s press conference to get cues about the monetary policy and the labor market outlook. Investors would also focus on cues regarding the impact of tariffs on inflation.
- In Tuesday’s session, investors will focus on the US Retail Sales data for August, which will be published at 12:30 GMT. Sales are expected to grow by 0.3% on a monthly basis, slower than the prior 0.5% increase.
Technical Analysis: Pound Sterling jumps to near 1.3650
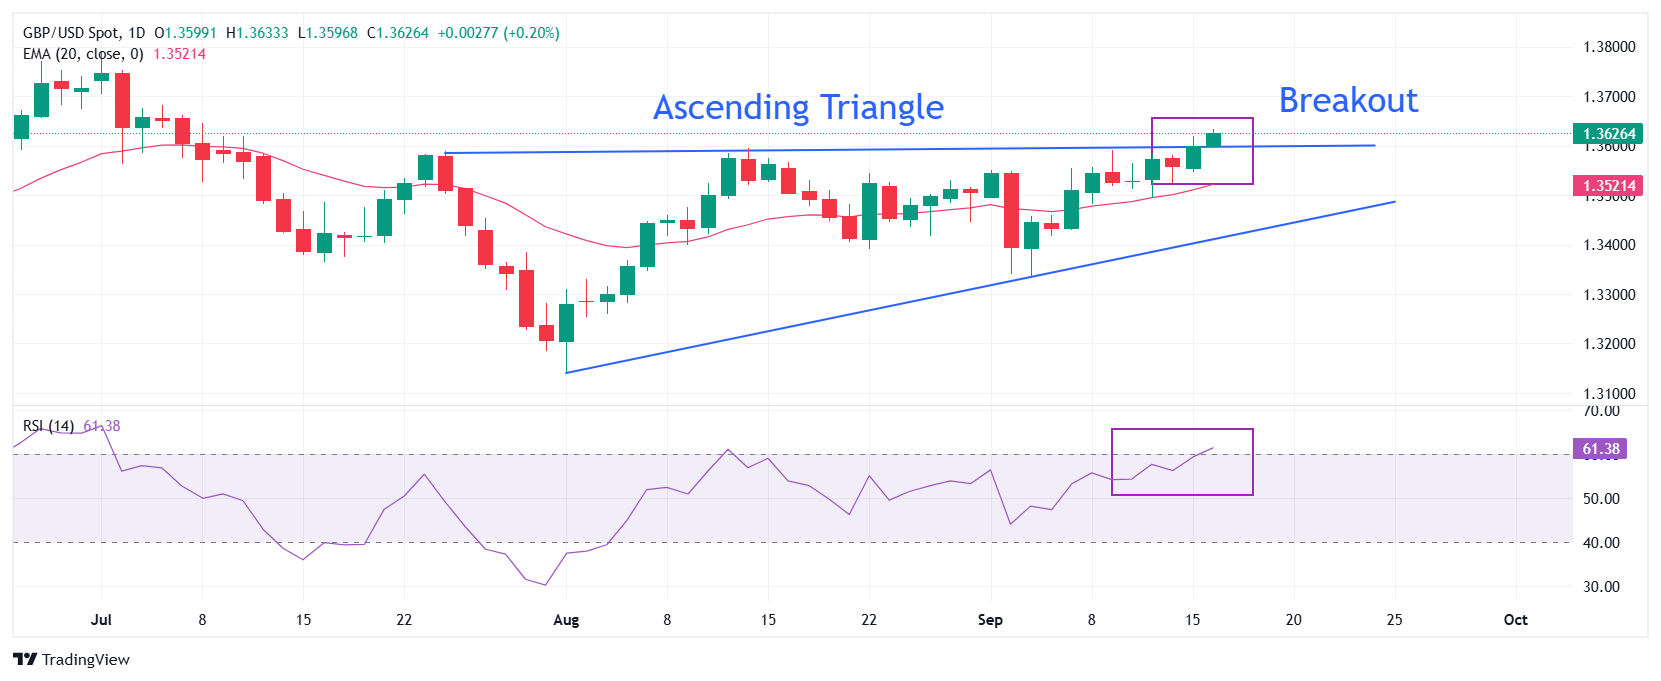
The Pound Sterling climbs to near 1.3650 against the US Dollar on Tuesday, the highest level seen in over two months. With the latest jump, the GBP/USD pair breaks out from an Ascending Triangle formation.
The horizontal resistance of the above-mentioned chart pattern is plotted from the July 23 high around 1.3585, while the upward-sloping border is drawn from the August 1 low near 1.3140.
A decisive breakout of the Ascending Triangle chart pattern could result in a fresh upside move.
The near-term trend of the Cable remains bullish as it trades close to the 20-day Exponential Moving Average (EMA), which is around 1.3520.
The 14-day Relative Strength Index (RSI) breaks above 60, indicating a strong upside momentum.
Looking down, the August 1 low of 1.3140 will act as a key support zone. On the upside, the July 1 high near 1.3800 will act as a key barrier.
Related Articles
Amazon Stock Predictions for 2026 to 2030: Will They Exceed Expectations and Achieve Major Long-Term Goals?
TradingKey - As we head into 2026, many investors are questioning where Amazon (AMZN) fits into the technology world.
A Crash After a Surge: Why Silver Lost 40% in a Week?
TradingKey - Spot silver (XAGUSD) prices continue to decline. Silver plunged 20% on Thursday, breaking below $71 per ounce, with the sell-off intensifying on Friday as prices fell further below $64. Compared to the all-time high set on January 29, silver prices have retraced more than 40%, wiping out nearly all gains accumulated over the previous month.
Google Cloud Revenue Surges 48% in Q4 as CapEx Guidance Nearly Doubles: Why the 7.5% After-Hours Dip?
TradingKey - After the close on February 4 (ET), Google (GOOG, GOOGL) released stellar Q4 results: total revenue grew 18% year-over-year, hitting a new quarterly record after revenue first surpassed $100 billion in Q3. The primary highlight was Google Cloud, where Q4 revenue surged 48% year-over-yea
Is Bitcoin’s Four-Year Cycle Dead in 2026?
Is the Bitcoin 4-year cycle dead? After 2025 broke historical records with a red post-halving year, institutional analysts explore if the Bitcoin price has decoupled from the halving countdown. Analyze the impact of spot ETFs, global liquidity, and the roadmap to the 2028 halving in this 2026 market

