

Pound Sterling outperforms ahead of Fed and BoE monetary policy decisions

- The Pound Sterling rises at the start of the week ahead of the Fed and BoE monetary policy announcements.
- Investors expect the Fed to cut interest rates, while the BoE is seen holding them steady.
- UK headline CPI is estimated at a faster pace of 3.9% in August.
The Pound Sterling (GBP) advances against the US Dollar (USD) at the start of the week during the European trading session. The GBP/USD pair jumps to near 1.3600as the US Dollar faces selling pressure, with investors awaiting monetary policy announcements by the Federal Reserve (Fed) and the Bank of England (BoE) on Wednesday and Thursday, respectively.
During the press time, the US Dollar Index (DXY), which tracks the Greenback’s value against six major currencies, trades marginally down near 97.50.
According to the CME FedWatch tool, traders see a 94,2% chance that the central bank will cut interest rates by 25 basis points (bps) to 4.00%-4.25% in the policy announcement on Wednesday. Fed dovish speculation has been intensified due to growing labor market concerns.
Meanwhile, the BoE is expected to hold interest rates steady at 4% as inflationary pressures in the United Kingdom (UK) economy are continuing to prove persistent.
Pound Sterling Price Today
The table below shows the percentage change of British Pound (GBP) against listed major currencies today. British Pound was the strongest against the US Dollar.
| USD | EUR | GBP | JPY | CAD | AUD | NZD | CHF | |
|---|---|---|---|---|---|---|---|---|
| USD | -0.11% | -0.28% | -0.18% | -0.05% | -0.22% | -0.14% | -0.12% | |
| EUR | 0.11% | -0.14% | -0.12% | 0.07% | -0.08% | -0.07% | -0.02% | |
| GBP | 0.28% | 0.14% | 0.08% | 0.21% | 0.06% | 0.07% | 0.00% | |
| JPY | 0.18% | 0.12% | -0.08% | 0.12% | 0.00% | 0.03% | 0.07% | |
| CAD | 0.05% | -0.07% | -0.21% | -0.12% | -0.07% | -0.14% | -0.20% | |
| AUD | 0.22% | 0.08% | -0.06% | -0.01% | 0.07% | 0.00% | 0.02% | |
| NZD | 0.14% | 0.07% | -0.07% | -0.03% | 0.14% | -0.01% | -0.06% | |
| CHF | 0.12% | 0.02% | -0.01% | -0.07% | 0.20% | -0.02% | 0.06% |
The heat map shows percentage changes of major currencies against each other. The base currency is picked from the left column, while the quote currency is picked from the top row. For example, if you pick the British Pound from the left column and move along the horizontal line to the US Dollar, the percentage change displayed in the box will represent GBP (base)/USD (quote).
Pound Sterling to be influenced by UK employment and inflation data
- Investors brace for significant volatility in the Pound Sterling this week as the United Kingdom (UK) labor market data for the three months ending July and the Consumer Price Index (CPI) data for August are also scheduled to be released this week on Tuesday and Wednesday, respectively.
- The Office for National Statistics (ONS) is expected to show that the ILO Unemployment Rate remains steady at 4.7%. Average Earnings Excluding Bonuses, a key measure of wage growth, is estimated to have grown at an annual pace of 4.8%, slower than the prior reading of 5%. However, the wage growth measure including bonuses is expected to have risen at a faster pace of 4.7% from the former reading of 4.6%.
- Lately, BoE Governor Andrew Bailey has warned of downside labor market risks and stated that the monetary policy path will remain downwards.
- Meanwhile, the UK headline CPI is expected to have risen at a faster pace of 3.9%, the highest level in 19 months. BoE officials would need to perform a delicate balancing act if the inflation data shows signs of growth and the labor market faces a slowdown.
- In the US, investors await the Retail Sales figures for August, which will be published on Tuesday. The US Retail Sales data, a key measure of consumer spending, is expected to have grown at a moderate pace of 0.3% against 0.5% in July.
Technical Analysis: Pound Sterling trades firmly above 20-day EMA
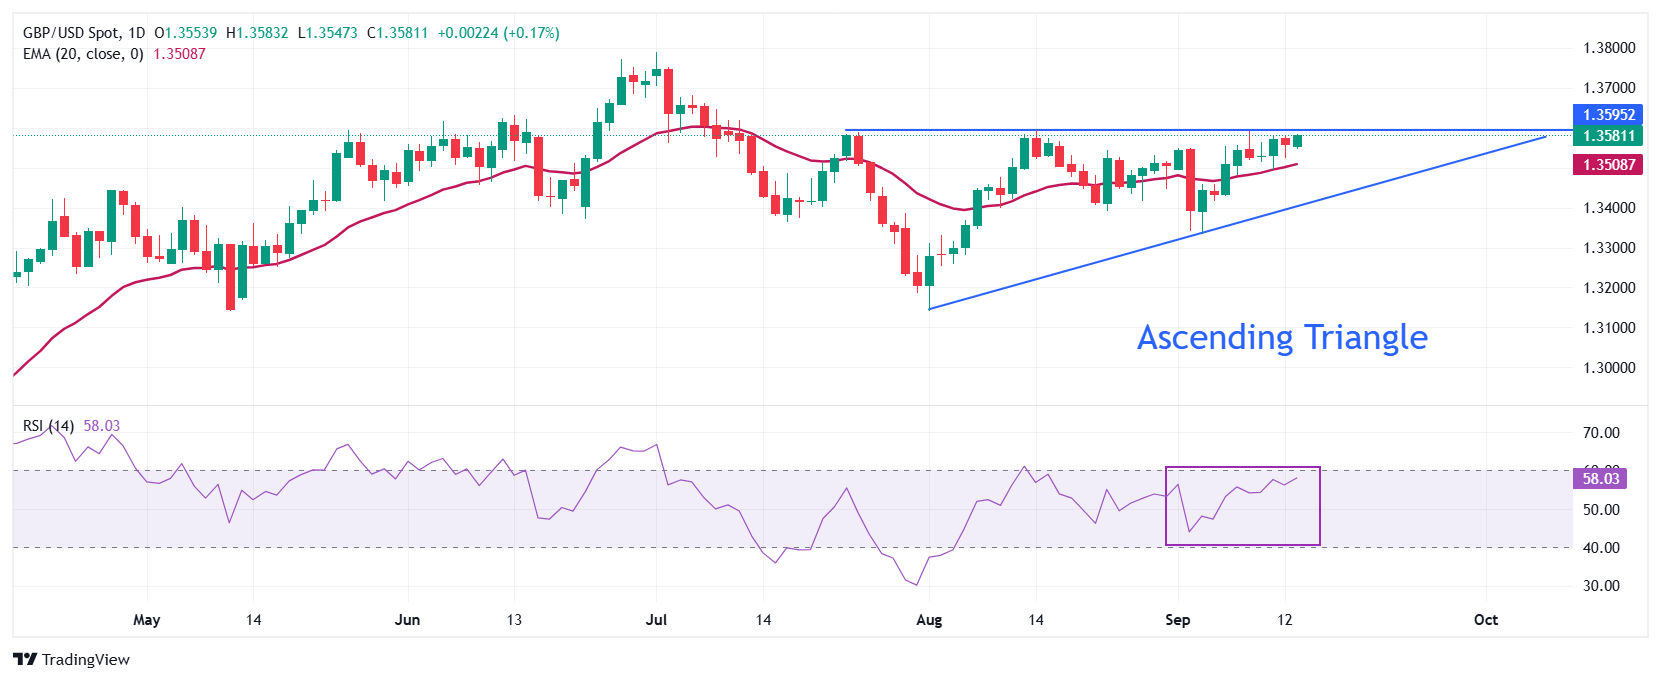
The Pound Sterling edges higher to near 1.3580 against the US Dollar on Monday. The near-term trend of the Cable remains sideways as it trades close to the 20-day Exponential Moving Average (EMA), which is around 1.3508.
The Cable trades inside the Ascending Triangle chart pattern, which indicates indecisiveness among investors. The horizontal resistance of the above-mentioned chart pattern is plotted from the July 23 high around 1.3585, while the upward-sloping border is placed from the August 1 low near 1.3140.
The 14-day Relative Strength Index (RSI) oscillates inside the 40.00-60.00 range, indicating a sideways trend.
Looking down, the August 1 low of 1.3140 will act as a key support zone. On the upside, the July 1 high near 1.3800 will act as a key barrier.
Economic Indicator
ILO Unemployment Rate (3M)
The ILO Unemployment Rate released by the UK Office for National Statistics is the number of unemployed workers divided by the total civilian labor force. It is a leading indicator for the UK Economy. If the rate goes up, it indicates a lack of expansion within the UK labor market. As a result, a rise leads to a weakening of the UK economy. Generally, a decrease of the figure is seen as bullish for the Pound Sterling (GBP), while an increase is seen as bearish.
Next release: Tue Sep 16, 2025 06:00
Frequency: Monthly
Consensus: 4.7%
Previous: 4.7%
Source: Office for National Statistics
The Unemployment Rate is the broadest indicator of Britain’s labor market. The figure is highlighted by the broad media, beyond the financial sector, giving the publication a more significant impact despite its late publication. It is released around six weeks after the month ends. While the Bank of England is tasked with maintaining price stability, there is a substantial inverse correlation between unemployment and inflation. A higher than expected figure tends to be GBP-bearish.
Recommended Articles


Comments (0)
Click the $ button, enter the symbol, and select to link a stock, ETF, or other ticker.