

Japanese Yen surrenders intraday gains; USD/JPY climbs back to 156.00 neighborhood

- The Japanese Yen struggles to capitalize on its Asian session gains against the USD on Monday.
- The BoJ’s hawkish outlook and the narrowing US-Japan yield differential favor the JPY bulls.
- Fed rate cut bets could act as a headwind for the buck and cap the upside for the USD/JPY pair.
The Japanese Yen (JPY) surrenders a major part of Asian session gains against its American counterpart after the White House said that Colombia has agreed to accept illegal migrants returned from the US. Adding to this, a modest US Dollar (USD) recovery from over a one-month low touched on Friday assist the USD/JPY pair to move back closer to the daily top in the last hour. Any meaningful JPY depreciation, however, seems elusive in the wake of the Bank of Japan's (BoJ) hawkish outlook.
Apart from this, persistent uncertainty surrounding US President Donald Trump's trade policies could act as a tailwind for the safe-haven JPY. Moreover, the prospects for further policy easing by the Federal Reserve (Fed) might hold back the USD bulls from placing aggressive bets. Meanwhile, the divergent BoJ-Fed policy expectations resulted in the recent narrowing of the US-Japan, which should continue to benefit the lower-yielding JPY and keep a lid on any further upside for the USD/JPY pair.
Japanese Yen bulls have the upper hand amid trade war fears, BoJ's hawkish outlook
- US President Donald Trump imposed 25% tariffs on all imports from Colombia after the latter refused to allow two US military planes carrying deported migrants to land in the country.
- Trump warned that the tariffs will increase to 50% by next week on further noncompliance, fueling trade war concerns and boosting demand for the traditional safe-haven Japanese Yen.
- Adding to this, the Wall Street Journal (WSJ) reported that momentum is growing among Trump’s advisers to place 25% tariffs on Mexico and Canada as soon as February 1.
- The White House confirmed on Monday that Colombia has agreed to all of Trump’s terms, including unrestricted acceptance of all illegal aliens from Colombia returned from the US.
- The anti-risk flow, along with Federal Reserve rate cut bets, drags the US Treasury bond yields lower, narrowing the US-Japan yield differential and lending additional support to the JPY.
- The Bank of Japan decided to raise interest rates by 25 basis points, the biggest rate hike since February 2007, from 0.25% to 0.50%, or the highest since the 2008 global financial crisis.
- The BoJ reiterated that it would continue to raise the policy rate and adjust the degree of monetary accommodation if the outlook presented at the January policy meeting is realized.
- The BoJ does not expect consumer inflation to drop under its 2% target anytime soon and forecast slower growth, though it signaled that rising wages could fuel a ‘virtuous cycle’ of growth.
- Data released on Friday showed that Japan's core consumer inflation accelerated to the fastest annual pace in 16 months during December, pointing to broadening inflationary pressure.
- Annual spring wage negotiations kicked off in Japan, with the leaders of the top business lobby and labor unions agreeing on the need to maintain the momentum for pay hikes.
- Traders now look to Monday's US economic docket – featuring Durable Goods Orders, the Conference Board's Consumer Confidence Index and the Richmond Manufacturing Index.
USD/JPY manages to defend ascending channel support; not out of the woods yet
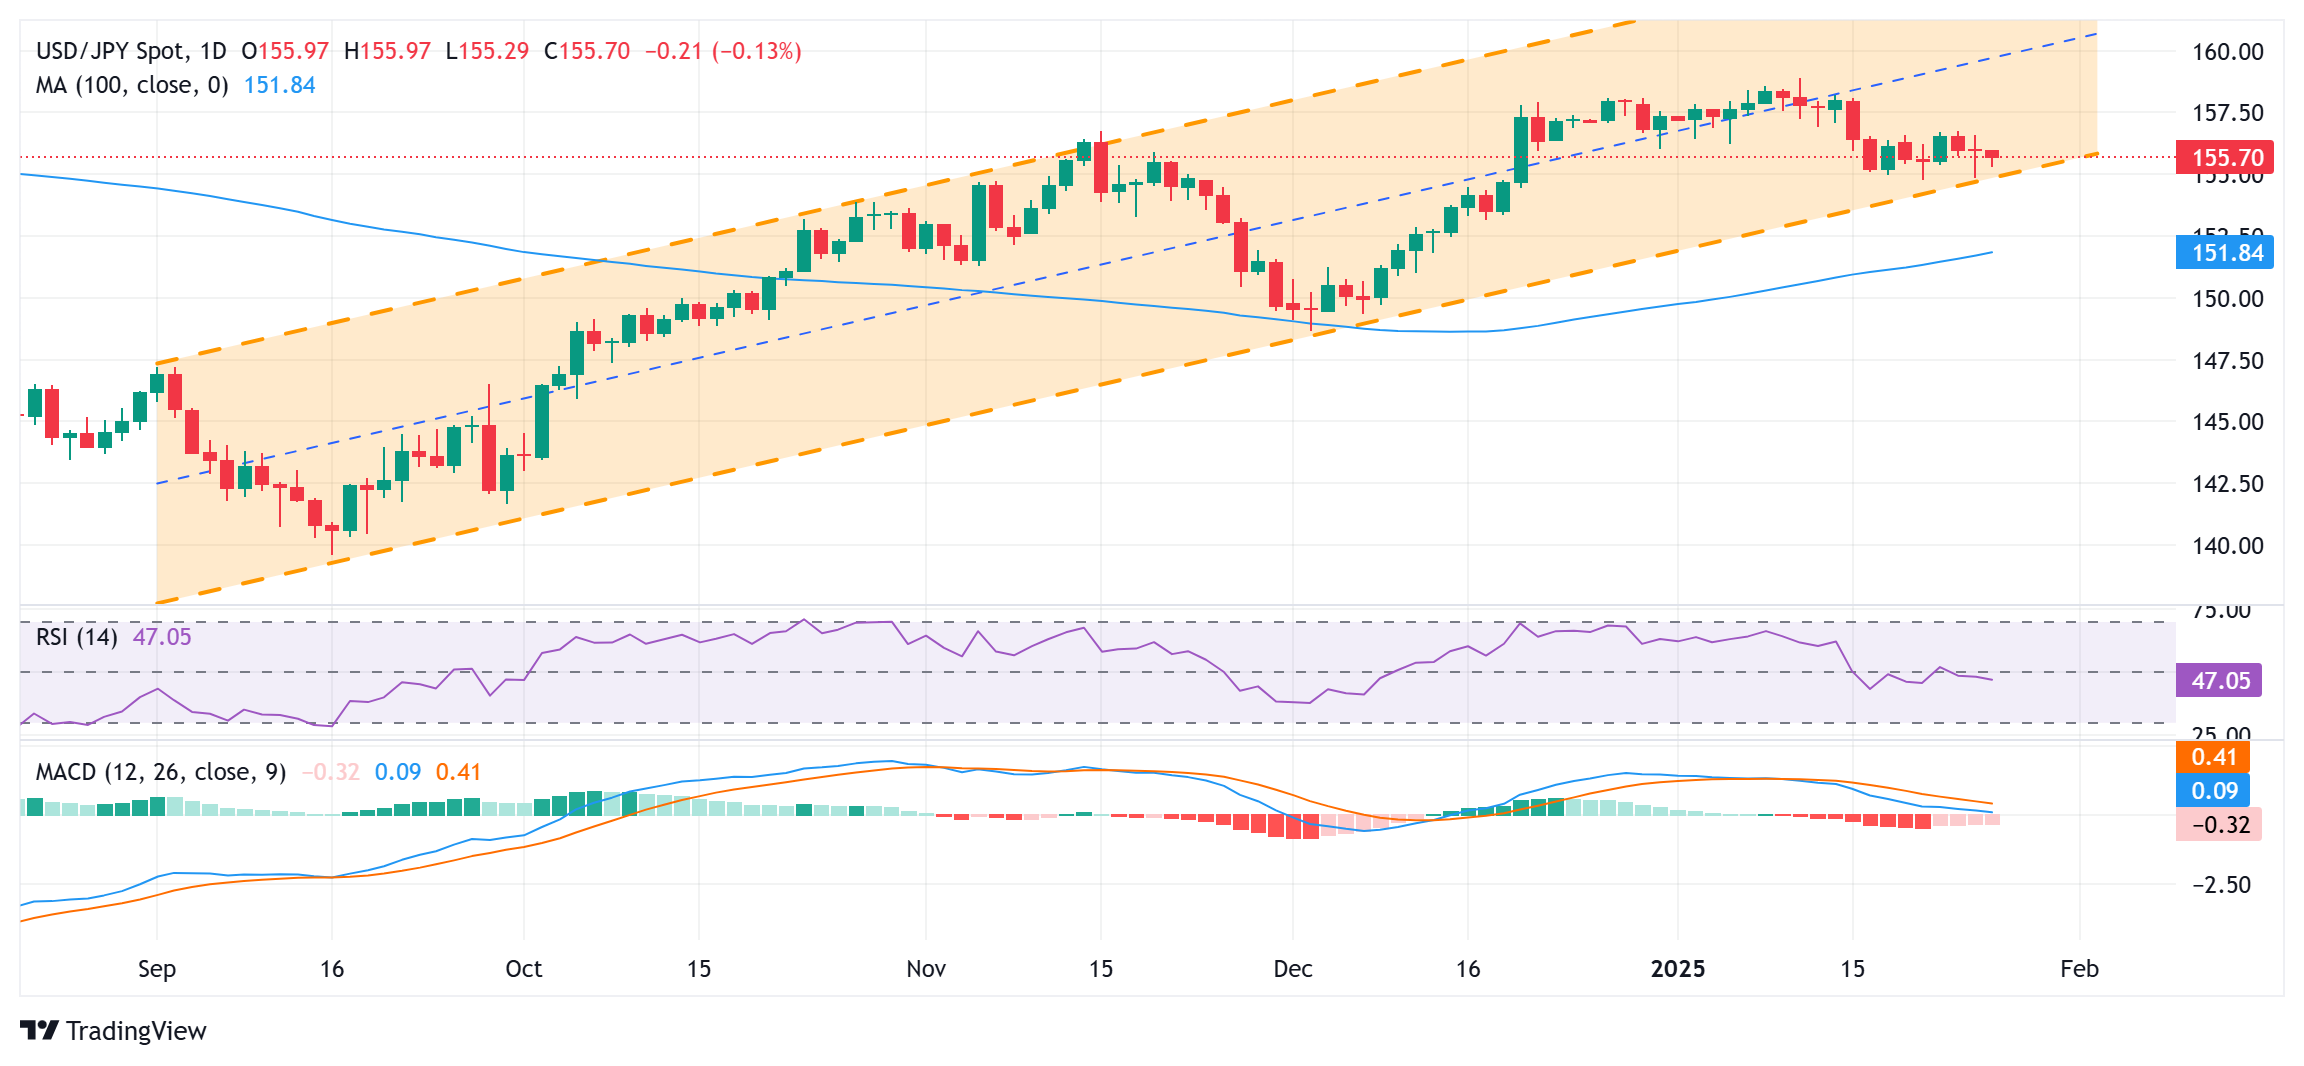
From a technical perspective, any subsequent fall might continue to find support near the lower boundary of a multi-month-old ascending channel, currently pegged near the 155.25 region. This is closely followed by the 155.00 psychological mark and the 154.80-154.75 support, which if broken decisively will be seen as a fresh trigger for bearish traders. Given that oscillators on the daily chart have just started gaining negative traction, the USD/JPY pair might then accelerate the fall towards the 154.00 round figure en route to mid-153.00s and the 153.00 mark.
On the flip side, any attempted recovery might now confront some resistance near the 156.00 mark. The next relevant hurdle is pegged near the 156.75 supply zone. Some follow-through buying, leading to subsequent strength beyond the 157.00 mark, should pave the way for a move towards the 157.55 area en route to the 158.00 mark. The USD/JPY could eventually climb to the 158.35-158.40 region before aiming to retest the multi-month peak, around the 159.00 neighborhood touched on January 10.
US Dollar PRICE Today
The table below shows the percentage change of US Dollar (USD) against listed major currencies today. US Dollar was the strongest against the New Zealand Dollar.
| USD | EUR | GBP | JPY | CAD | AUD | NZD | CHF | |
|---|---|---|---|---|---|---|---|---|
| USD | 0.33% | 0.26% | 0.19% | 0.16% | 0.38% | 0.39% | 0.19% | |
| EUR | -0.33% | -0.00% | 0.02% | -0.03% | 0.05% | 0.17% | -0.04% | |
| GBP | -0.26% | 0.00% | -0.31% | -0.02% | 0.05% | 0.18% | -0.04% | |
| JPY | -0.19% | -0.02% | 0.31% | 0.01% | 0.36% | 0.43% | 0.14% | |
| CAD | -0.16% | 0.03% | 0.02% | -0.01% | 0.02% | 0.22% | -0.01% | |
| AUD | -0.38% | -0.05% | -0.05% | -0.36% | -0.02% | 0.16% | -0.05% | |
| NZD | -0.39% | -0.17% | -0.18% | -0.43% | -0.22% | -0.16% | -0.44% | |
| CHF | -0.19% | 0.04% | 0.04% | -0.14% | 0.00% | 0.05% | 0.44% |
The heat map shows percentage changes of major currencies against each other. The base currency is picked from the left column, while the quote currency is picked from the top row. For example, if you pick the US Dollar from the left column and move along the horizontal line to the Japanese Yen, the percentage change displayed in the box will represent USD (base)/JPY (quote).
Recommended Articles


Comments (0)
Click the $ button, enter the symbol, and select to link a stock, ETF, or other ticker.