

Japanese Yen depreciates, possibly due to investors' caution ahead of US data
- The Japanese Yen depreciates as investors adopt caution ahead of the US ADP Employment Change and ISM Services PMI.
- JPY could find support as Labor Cash Earnings surged by 2.1% YoY in April, marking the highest level since June last year.
- The US Dollar may struggle due to the rising possibility of the Fed implementing its first rate cut in September.
The Japanese Yen (JPY) edged lower on Wednesday due to investors' caution ahead of key US data releases later in the day, including the US ADP Employment Change and ISM Services PMI reports. Attention is expected to shift toward the Nonfarm Payrolls (NFP) report, which is due on Friday.
The JPY could face further downward pressure due to the interest rate differential between the United States (US) and Japan, which supports the USD/JPY pair. However, the upside potential of the USD/JPY pair may be limited by higher-than-expected data from Japan released on Wednesday.
The Jibun Bank Japan Services PMI was revised higher to 53.8 in May from the previous figure of 53.6. Despite the upward revision, it fell short of April's 8-month peak of 54.3, indicating the softest growth in the service sector since February. Additionally, Labor Cash Earnings surged by 2.1% year-on-year in April, surpassing forecasts for a 1.7% gain. This latest figure also marked the highest level since June last year.
The US Dollar Index (DXY), which gauges the value of the US Dollar (USD) against six other major currencies, has edged higher due to the improvement in US Treasury yields. However, the weaker US Manufacturing PMI in May has raised the possibility of the US Federal Reserve (Fed) implementing its first rate cut in September.
Traders are now pricing in nearly 64.9% odds of a Fed rate cut of at least 25 basis points, up from 46.3% a week earlier, according to the CME FedWatch Tool.
Daily Digest Market Movers: Japanese Yen depreciates due to risk-off mood
- The JOLTS US Job Openings declined by 296,000 to 8.059 million in April, down from March's 8.355 million, marking the lowest level since February 2021. This figure also missed the market consensus of 8.340 million, data showed on Tuesday.
- Bank of Japan (BoJ) Governor Kazuo Ueda said on Tuesday that the central bank will conduct "nimble" market operations if long-term interest rates spike, signaling the BoJ's readiness to ramp up bond buying when necessary. Ueda also stated that the BoJ will adjust the degree of monetary support if underlying inflation accelerates in line with its forecast, per Reuters.
- Reuters also reported that Japan's government will highlight the challenges a weak Yen poses for households in this year's long-term economic policy roadmap. This focus on the Yen's impact is expected to maintain pressure on the Bank of Japan to either raise interest rates or reduce its extensive bond-buying program.
- The ISM Manufacturing PMI unexpectedly dropped to 48.7 in May, down from April's reading of 49.2 and below the forecast of 49.6. The US manufacturing sector experienced its second consecutive month of contraction.
- Reuters reported on Monday that Japanese Economy Minister Yoshitaka Shindo announced that the government will “continue efforts for primary balance to reach within surplus territory in FY 2025.” Shindo also expressed optimism, stating that “Real economic growth of 1.3% in FY 2025 is not so unrealistic.”
- Last week, Atlanta Fed President Raphael Bostic stated in an interview with Fox Business that he does not think additional rate increases are necessary to achieve the Fed's 2% annual inflation target. Furthermore, New York Fed President John Williams stated as per Reuters that inflation is currently too high but should start to decline in the second half of 2024. Williams believes that monetary policy action is not urgently needed.
Technical Analysis: USD/JPY rebounds to near 155.50
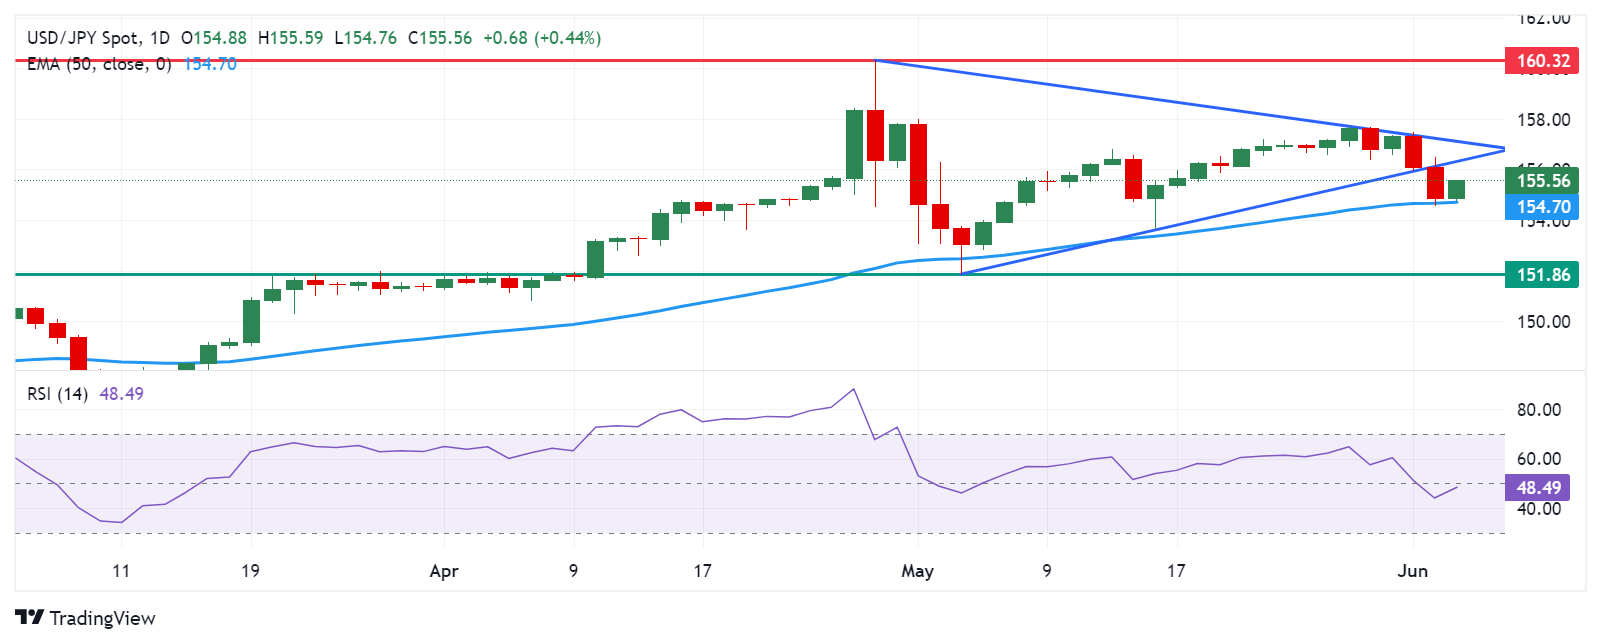
The USD/JPY pair trades around 155.50 on Wednesday. Analysis of the daily chart suggests a weakening bullish bias as the pair breaks below the lower boundary of the symmetrical triangle pattern. Additionally, the 14-day Relative Strength Index (RSI) is slightly below the 50 level, indicating a potential for further decline that may confirm a bearish bias.
Immediate support for the USD/JPY pair could be found at the psychological level of 155.00, followed by the 50-day Exponential Moving Average (EMA) at 154.70. A break below the latter could increase pressure on the pair, potentially leading it toward the region around throwback support at 151.86.
On the upside, a key barrier is evident at the psychological level of 156.00, followed by the lower threshold of the symmetrical triangle. If the USD/JPY pair returns into the symmetrical triangle, it would reinforce the bullish bias and could lead the pair to test the upper boundary of the pattern. A break above the psychological barrier of 157.00 would support the pair in retesting 160.32, its highest level in over thirty years.
USD/JPY: Daily Chart
Japanese Yen price today
The table below shows the percentage change of the Japanese Yen (JPY) against listed major currencies today. Japanese Yen was the weakest against the New Zealand Dollar.
| USD | EUR | GBP | CAD | AUD | JPY | NZD | CHF | |
| USD | 0.06% | 0.01% | 0.04% | -0.15% | 0.50% | -0.22% | 0.17% | |
| EUR | -0.07% | -0.06% | -0.03% | -0.19% | 0.44% | -0.26% | 0.12% | |
| GBP | 0.00% | 0.06% | 0.04% | -0.12% | 0.51% | -0.20% | 0.18% | |
| CAD | -0.04% | 0.03% | -0.04% | -0.17% | 0.49% | -0.24% | 0.16% | |
| AUD | 0.15% | 0.20% | 0.13% | 0.18% | 0.64% | -0.07% | 0.32% | |
| JPY | -0.49% | -0.45% | -0.50% | -0.49% | -0.64% | -0.71% | -0.33% | |
| NZD | 0.22% | 0.27% | 0.21% | 0.25% | 0.07% | 0.69% | 0.38% | |
| CHF | -0.16% | -0.12% | -0.18% | -0.14% | -0.31% | 0.33% | -0.38% |
The heat map shows percentage changes of major currencies against each other. The base currency is picked from the left column, while the quote currency is picked from the top row. For example, if you pick the Euro from the left column and move along the horizontal line to the Japanese Yen, the percentage change displayed in the box will represent EUR (base)/JPY (quote).
Risk sentiment FAQs
In the world of financial jargon the two widely used terms “risk-on” and “risk off'' refer to the level of risk that investors are willing to stomach during the period referenced. In a “risk-on” market, investors are optimistic about the future and more willing to buy risky assets. In a “risk-off” market investors start to ‘play it safe’ because they are worried about the future, and therefore buy less risky assets that are more certain of bringing a return, even if it is relatively modest.
Typically, during periods of “risk-on”, stock markets will rise, most commodities – except Gold – will also gain in value, since they benefit from a positive growth outlook. The currencies of nations that are heavy commodity exporters strengthen because of increased demand, and Cryptocurrencies rise. In a “risk-off” market, Bonds go up – especially major government Bonds – Gold shines, and safe-haven currencies such as the Japanese Yen, Swiss Franc and US Dollar all benefit.
The Australian Dollar (AUD), the Canadian Dollar (CAD), the New Zealand Dollar (NZD) and minor FX like the Ruble (RUB) and the South African Rand (ZAR), all tend to rise in markets that are “risk-on”. This is because the economies of these currencies are heavily reliant on commodity exports for growth, and commodities tend to rise in price during risk-on periods. This is because investors foresee greater demand for raw materials in the future due to heightened economic activity.
The major currencies that tend to rise during periods of “risk-off” are the US Dollar (USD), the Japanese Yen (JPY) and the Swiss Franc (CHF). The US Dollar, because it is the world’s reserve currency, and because in times of crisis investors buy US government debt, which is seen as safe because the largest economy in the world is unlikely to default. The Yen, from increased demand for Japanese government bonds, because a high proportion are held by domestic investors who are unlikely to dump them – even in a crisis. The Swiss Franc, because strict Swiss banking laws offer investors enhanced capital protection.
Related Articles
$660B Capex Bill Triggers $900B Wipeout: Why Apple Shares Outperform Amazon and Google Despite AI Lag
Based on financial disclosures, the combined 2026 capital expenditure forecasts for Meta, Amazon, Google, and Microsoft are projected to reach $660 billion. This figure is not only significantly higher than the $410 billion forecast for 2025 and $245 billion for 2024, but even surpasses the GDP of I
Amazon Stock Predictions for 2026 to 2030: Will They Exceed Expectations and Achieve Major Long-Term Goals?
TradingKey - As we head into 2026, many investors are questioning where Amazon (AMZN) fits into the technology world.
A Crash After a Surge: Why Silver Lost 40% in a Week?
TradingKey - Spot silver (XAGUSD) prices continue to decline. Silver plunged 20% on Thursday, breaking below $71 per ounce, with the sell-off intensifying on Friday as prices fell further below $64. Compared to the all-time high set on January 29, silver prices have retraced more than 40%, wiping out nearly all gains accumulated over the previous month.
Is Bitcoin’s Four-Year Cycle Dead in 2026?
Is the Bitcoin 4-year cycle dead? After 2025 broke historical records with a red post-halving year, institutional analysts explore if the Bitcoin price has decoupled from the halving countdown. Analyze the impact of spot ETFs, global liquidity, and the roadmap to the 2028 halving in this 2026 market

