

Bitcoin Price Forecast: BTC extends losses, pressured by ETF outflows, fresh inflation concerns

- Bitcoin edges lower for a fourth straight day on Monday after losing nearly 6% the previous week.
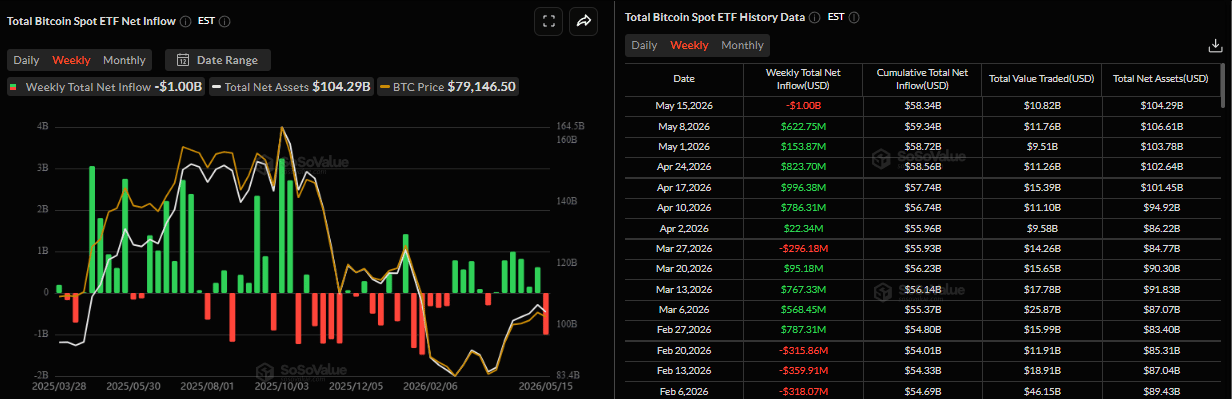
- US-listed BTC spot ETFs record a weekly outflow of $1 billion, the highest in three months.
- Hot US inflation data strengthen expectations of a more hawkish Fed, dampening risk appetite.
Bitcoin (BTC) trades in red, slipping below $76,800 on Monday after losing nearly 6% in the previous week. BTC has been correcting sharply, posting its fourth consecutive day of losses, as spot Exchange Traded Funds (ETFs) recorded weekly outflows of $1 billion. Meanwhile, hotter-than-expected US inflation data strengthened expectations of a more hawkish Federal Reserve (Fed), dampening risk appetite and further pressuring the Crypto King.
Hotter US inflation and hawkish Fed fuel BTC correction
The largest cryptocurrency by market capitalization began the week on a negative note, continuing its price decline. BTC faced rejection from the key technical resistance zone around $82,000 as explained in the previous report.
This technical level served as a strong overhead supply zone, with prices continuing to slide as holders’ profit-taking further fueled the correction.
In addition, the hotter-than-expected US April inflation figures released last week, and Thursday’s US Retail Sales data, added more fuel to this fire.
These fresh inflation concerns lifted market expectations for a more hawkish US Fed and continue to act as a tailwind for the US Dollar (USD), while weighing on risky assets such as BTC.
The risk of inflation leads the central bank to tighten policy, which generally doesn’t bode well for the Crypto King. In high-interest-rate environments, market liquidity declines, and markets shift towards safer, yield-bearing assets.
ETFs print $1 billion in outflows
On the institutional side, fading demand further fuels BTC’s correction. SoSoValue data showed that spot Bitcoin ETFs recorded $1 billion in outflows last week, the highest weekly withdrawals since the end of January. If this trend continues this week, BTC could see further correction ahead.
Bitcoin Price Forecast: BTC falls after testing overhead supply
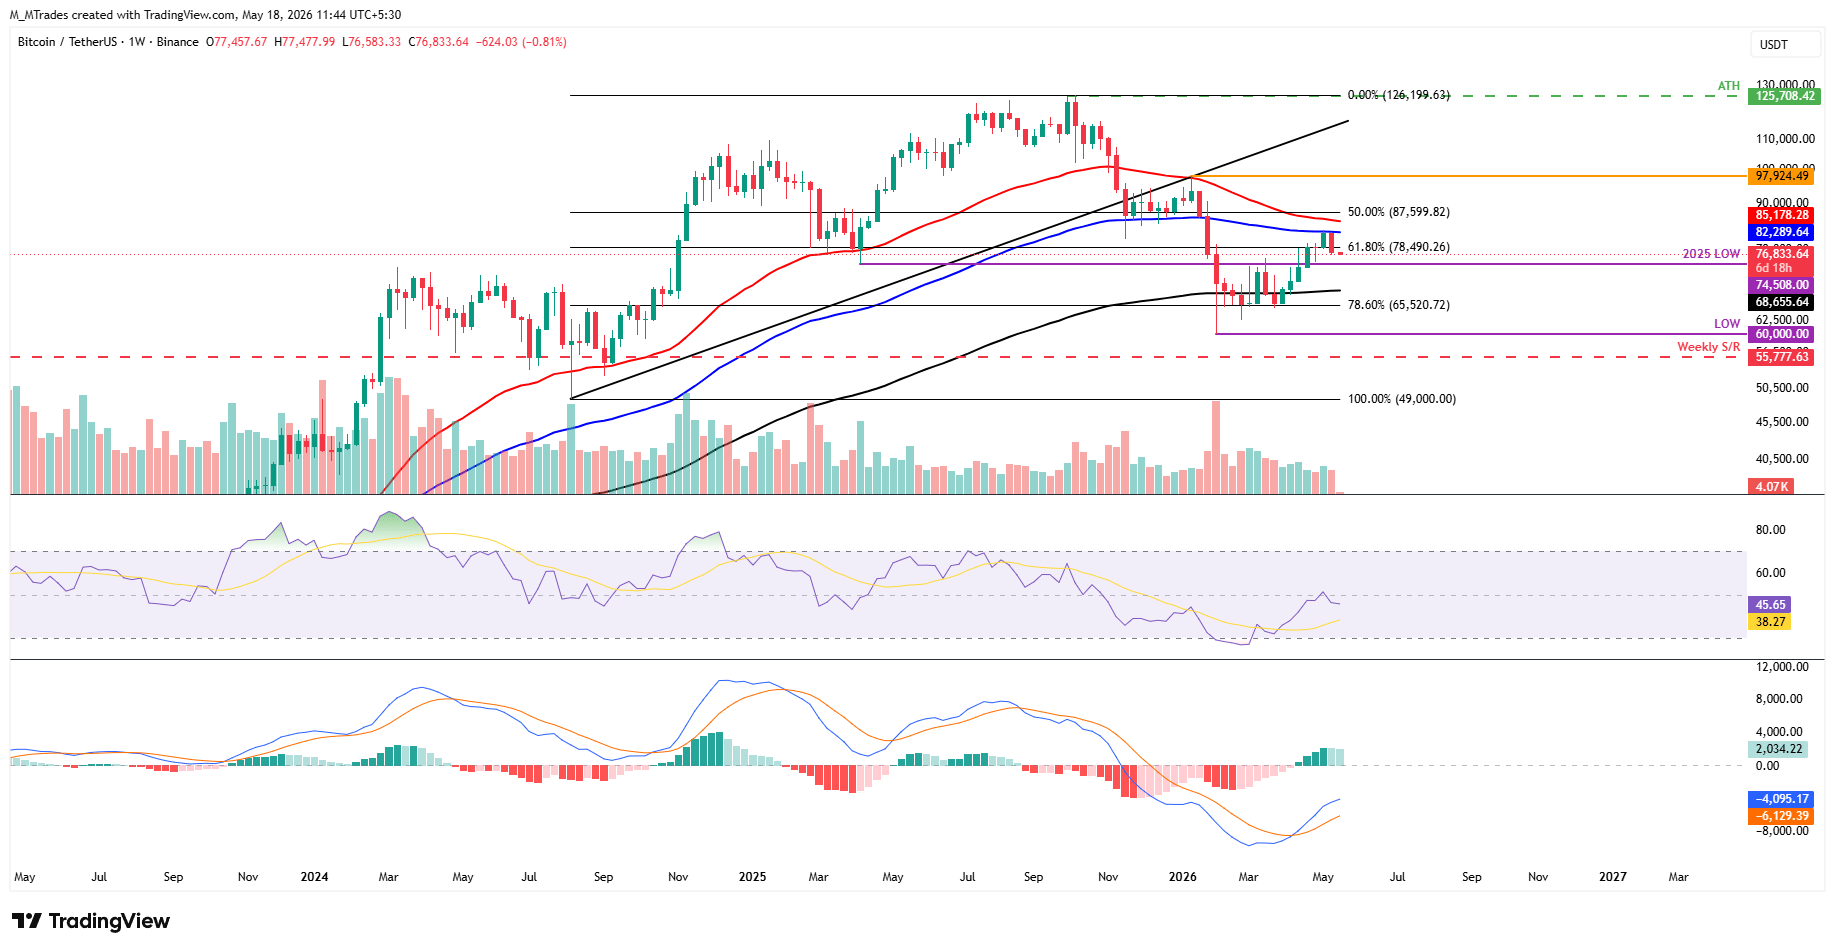
Bitcoin corrected more than 5% in the previous week after being rejected from the overhead supply near the 100-week Exponential Moving Average (EMA) at $82,289. Moreover, BTC closed the week below the 61.8% Fibonacci retracement level at $78,490 (drawn from the October all-time high of $126,199 to the February low of $60,000). As of the start of this week, BTC continues its fall, trading below $77,000.
If BTC continues its correction, it could extend the decline toward the key $75,000 psychological support.
Momentum is mixed, with signs of concern: the Relative Strength Index (RSI) on the weekly chart slips below the neutral level of 50, reading 45 on Monday, while the Moving Average Convergence Divergence (MACD) histogram remains firmly positive, hinting that bullish pressure is attempting to reassert itself despite the recent correction.
On the daily chart, BTC corrects to test the key support, as price holds just above the 50-day and 100-day EMAs at $76,732 and $76,865, respectively, but remains clearly capped beneath the 200-day EMA at $81,853.
The failed push beyond recent highs has shifted momentum lower, with the daily RSI slipping toward the mid-40s and the MACD on the same chart deeply negative, suggesting fading bullish pressure.
On the downside, initial support is seen at the 50-day and 100-day EMAs clustered just under the market, followed by the 38.2% Fibonacci retracement at roughly $74,487 (drawn from the January high to the February low), with the prior trendline breakout area near $70,576 and the 23.6% Fibonacci retracement around $68,950 protecting the wider bullish structure above the $60,000 swing low.
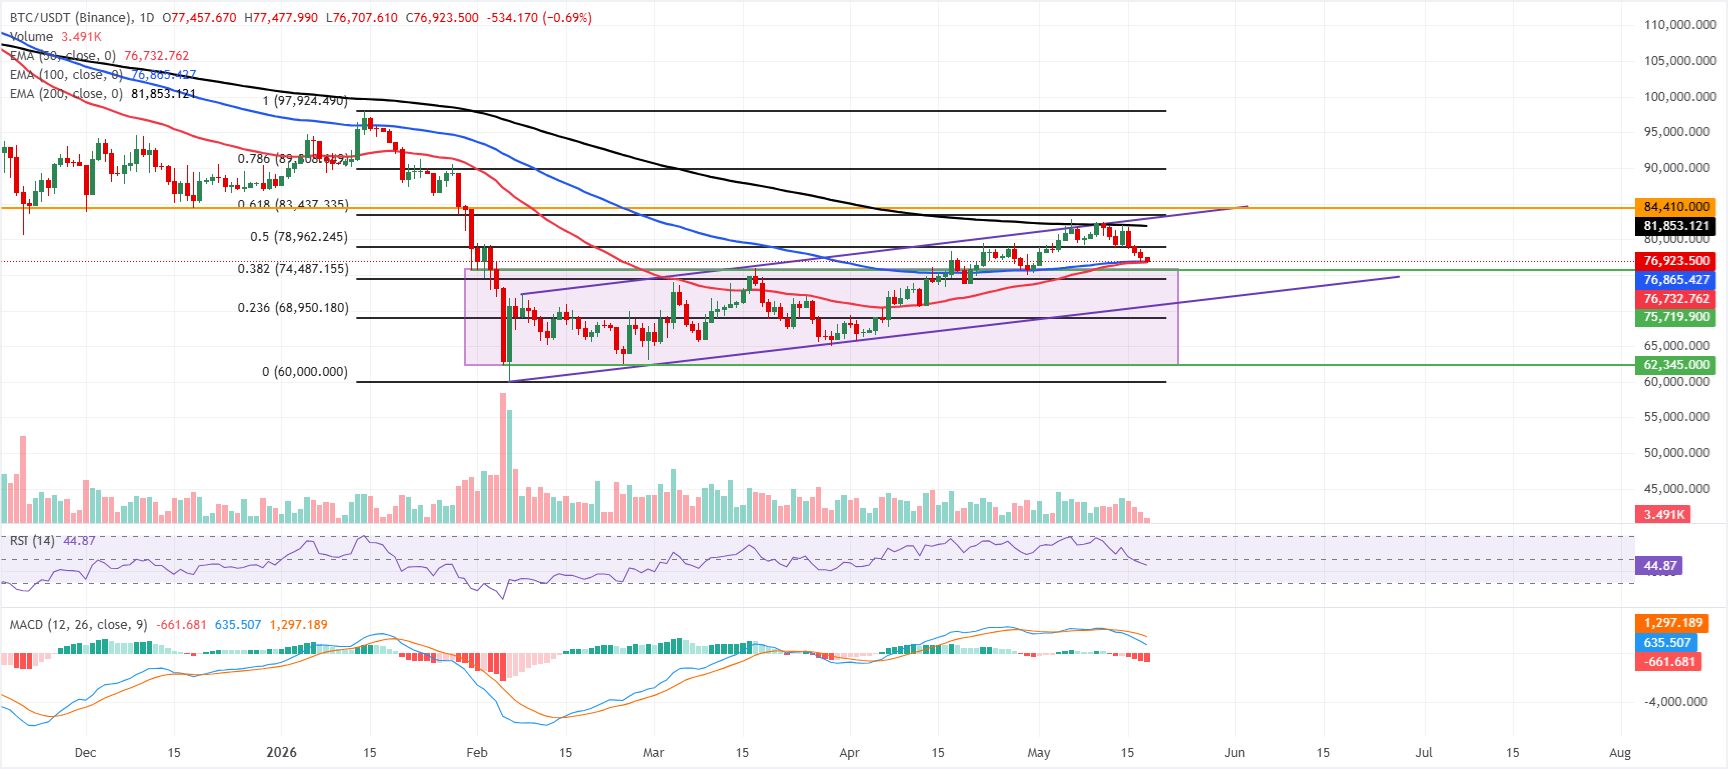
On the topside, immediate resistance emerges at the 50% retracement near $78,962, ahead of the 200-day EMA around $81,853, while a clearer bullish continuation would likely require a daily close above the 61.8% Fibonacci retracement at about $83,437 and the horizontal barrier near $84,410.
(The technical analysis of this story was written with the help of an AI tool.)
Bitcoin, altcoins, stablecoins FAQs
Bitcoin is the largest cryptocurrency by market capitalization, a virtual currency designed to serve as money. This form of payment cannot be controlled by any one person, group, or entity, which eliminates the need for third-party participation during financial transactions.
Altcoins are any cryptocurrency apart from Bitcoin, but some also regard Ethereum as a non-altcoin because it is from these two cryptocurrencies that forking happens. If this is true, then Litecoin is the first altcoin, forked from the Bitcoin protocol and, therefore, an “improved” version of it.
Stablecoins are cryptocurrencies designed to have a stable price, with their value backed by a reserve of the asset it represents. To achieve this, the value of any one stablecoin is pegged to a commodity or financial instrument, such as the US Dollar (USD), with its supply regulated by an algorithm or demand. The main goal of stablecoins is to provide an on/off-ramp for investors willing to trade and invest in cryptocurrencies. Stablecoins also allow investors to store value since cryptocurrencies, in general, are subject to volatility.
Bitcoin dominance is the ratio of Bitcoin's market capitalization to the total market capitalization of all cryptocurrencies combined. It provides a clear picture of Bitcoin’s interest among investors. A high BTC dominance typically happens before and during a bull run, in which investors resort to investing in relatively stable and high market capitalization cryptocurrency like Bitcoin. A drop in BTC dominance usually means that investors are moving their capital and/or profits to altcoins in a quest for higher returns, which usually triggers an explosion of altcoin rallies.
Recommended Articles


Comments (0)
Click the $ button, enter the symbol, and select to link a stock, ETF, or other ticker.