Pi Network Price Forecast: PI rally defies market pressure ahead of its first anniversary

- Pi Network is up over 3% on Wednesday, building on the 7% gains from the previous day.
- PI extends recovery as the mainnet migration halts ahead of its first anniversary.
- The technical outlook indicates rising bullish momentum, with immediate resistance in focus.
Pi Network (PI) is trading above $0.1900 at press time on Wednesday, extending the weekly gains by nearly 8% so far. The steady recovery is supported by a short-term pause in mainnet migration, which reduces pressure on the PI token supply for Centralized Exchanges (CEXs). The technical outlook focuses on the $0.1919 resistance as bullish momentum increases.
Halt in Mainnet migration reduces sell pressure
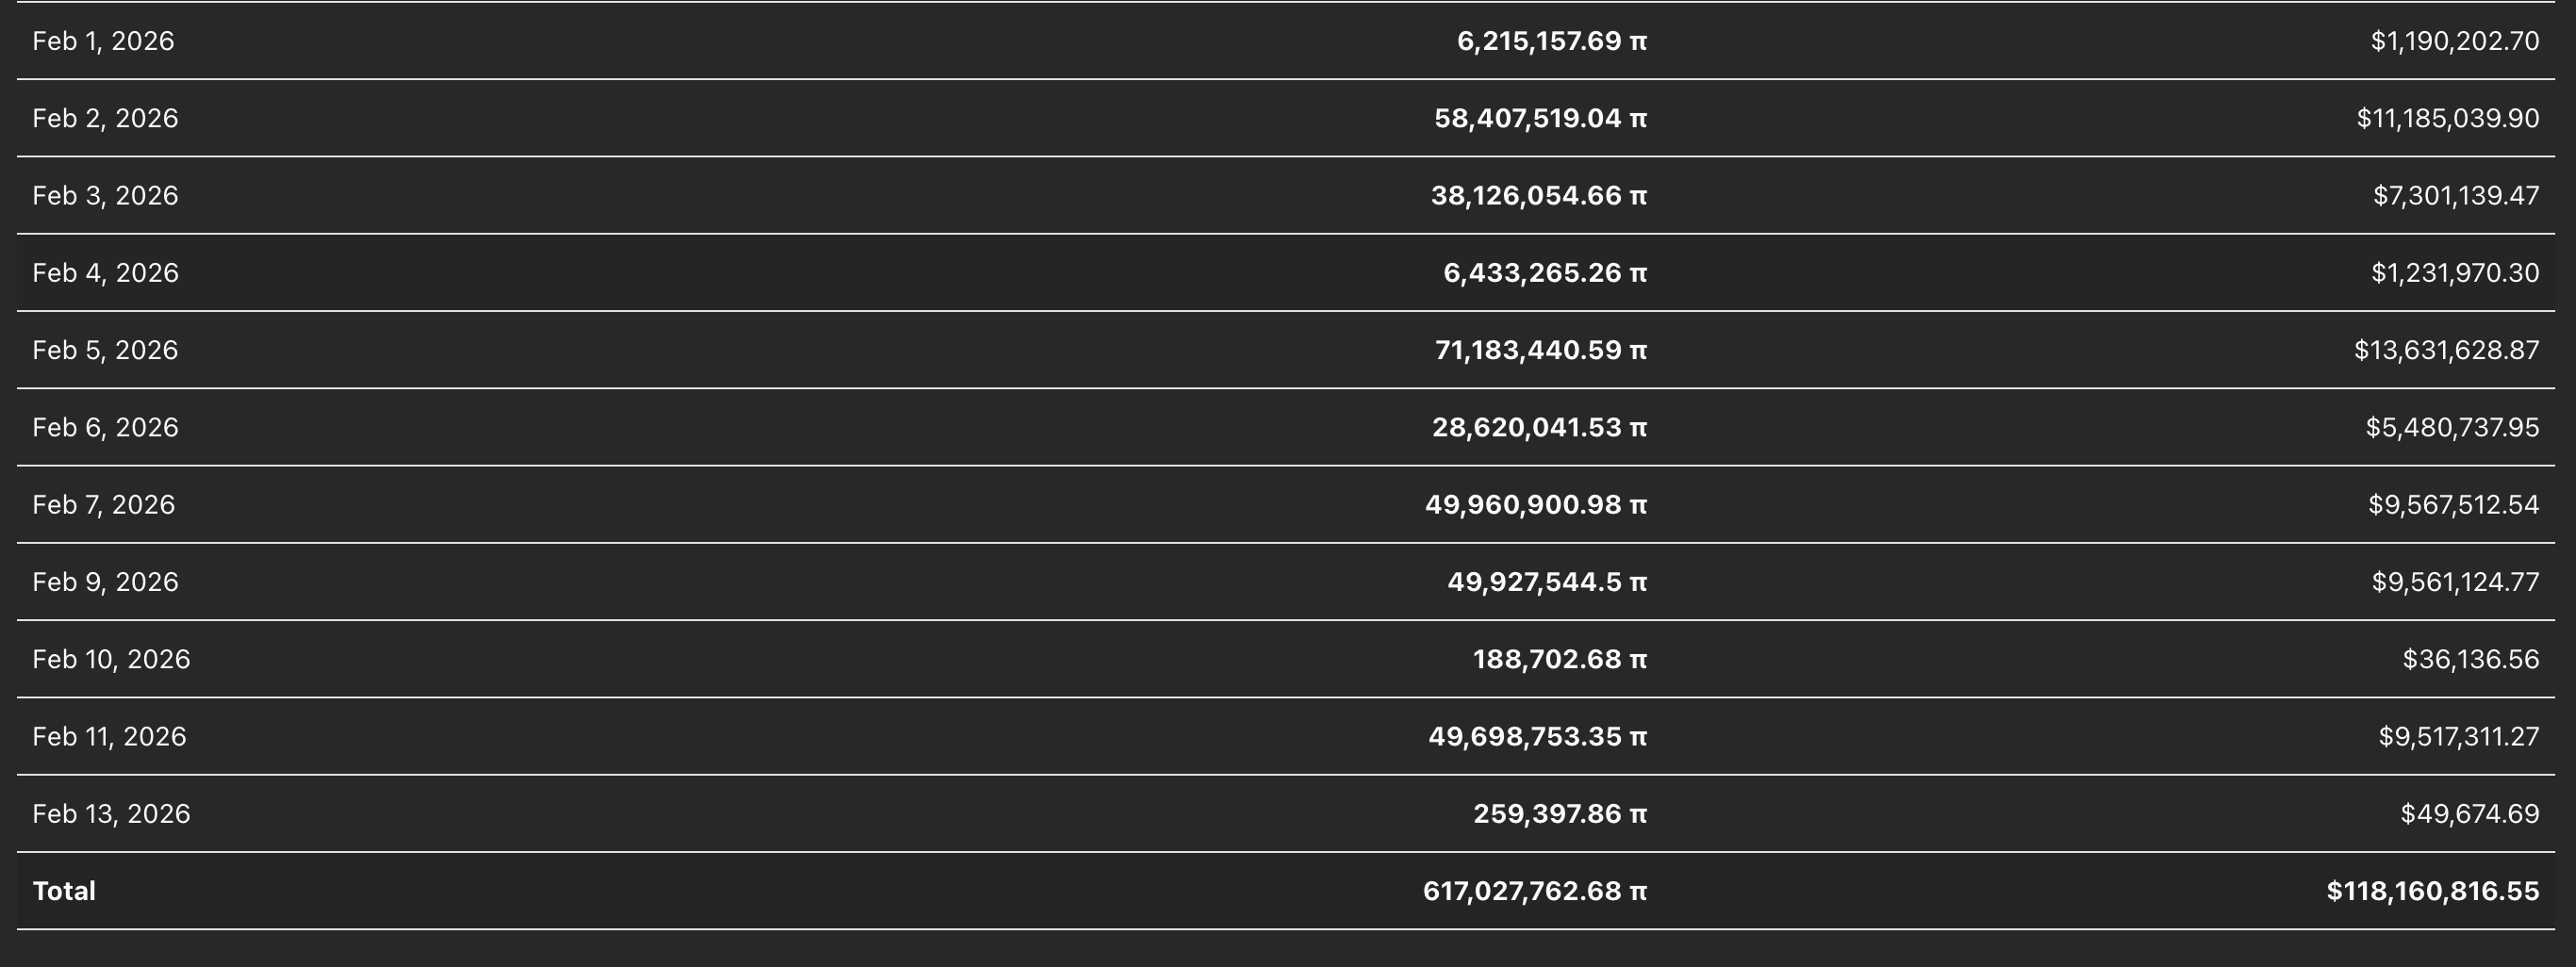
Pi scan data show that the mainnet migration, which allows users to deposit PI tokens from testnet after completing Know Your Customer (KYC) verification, has been inactive since Friday, with the last daily migration of 259,397 PI tokens. This has reduced pressure on the PI token supply for CEXs, supporting the demand spike, and aligns with the short-term recovery in the PI token price.
Pi Network rally approaches crucial resistance level
The PI token is trading above $0.1900 as of Wednesday, up nearly 3%. The PI token has surpassed the 50-day Exponential Moving Average (EMA) at $0.1773, indicating short-term buy-side bias.
The PI token is approaching the $0.1919 resistance level marked by the October 11 low, which previously served as crucial support on multiple occasions. A decisive close above this level could extend the rally to the $0.2177 resistance, aligning with the December 19 high.
The Relative Strength Index (RSI) is at 63 on the daily chart, showcasing a steady increase from the oversold region last week. This suggests a surge in buying pressure and indicates further upside before the market reaches the overbought zone. The Moving Average Convergence Divergence (MACD) approaches the zero line after a bullish crossover on Friday. Additionally, the MACD histogram's steady rise above the zero line indicates increasing bullish momentum.
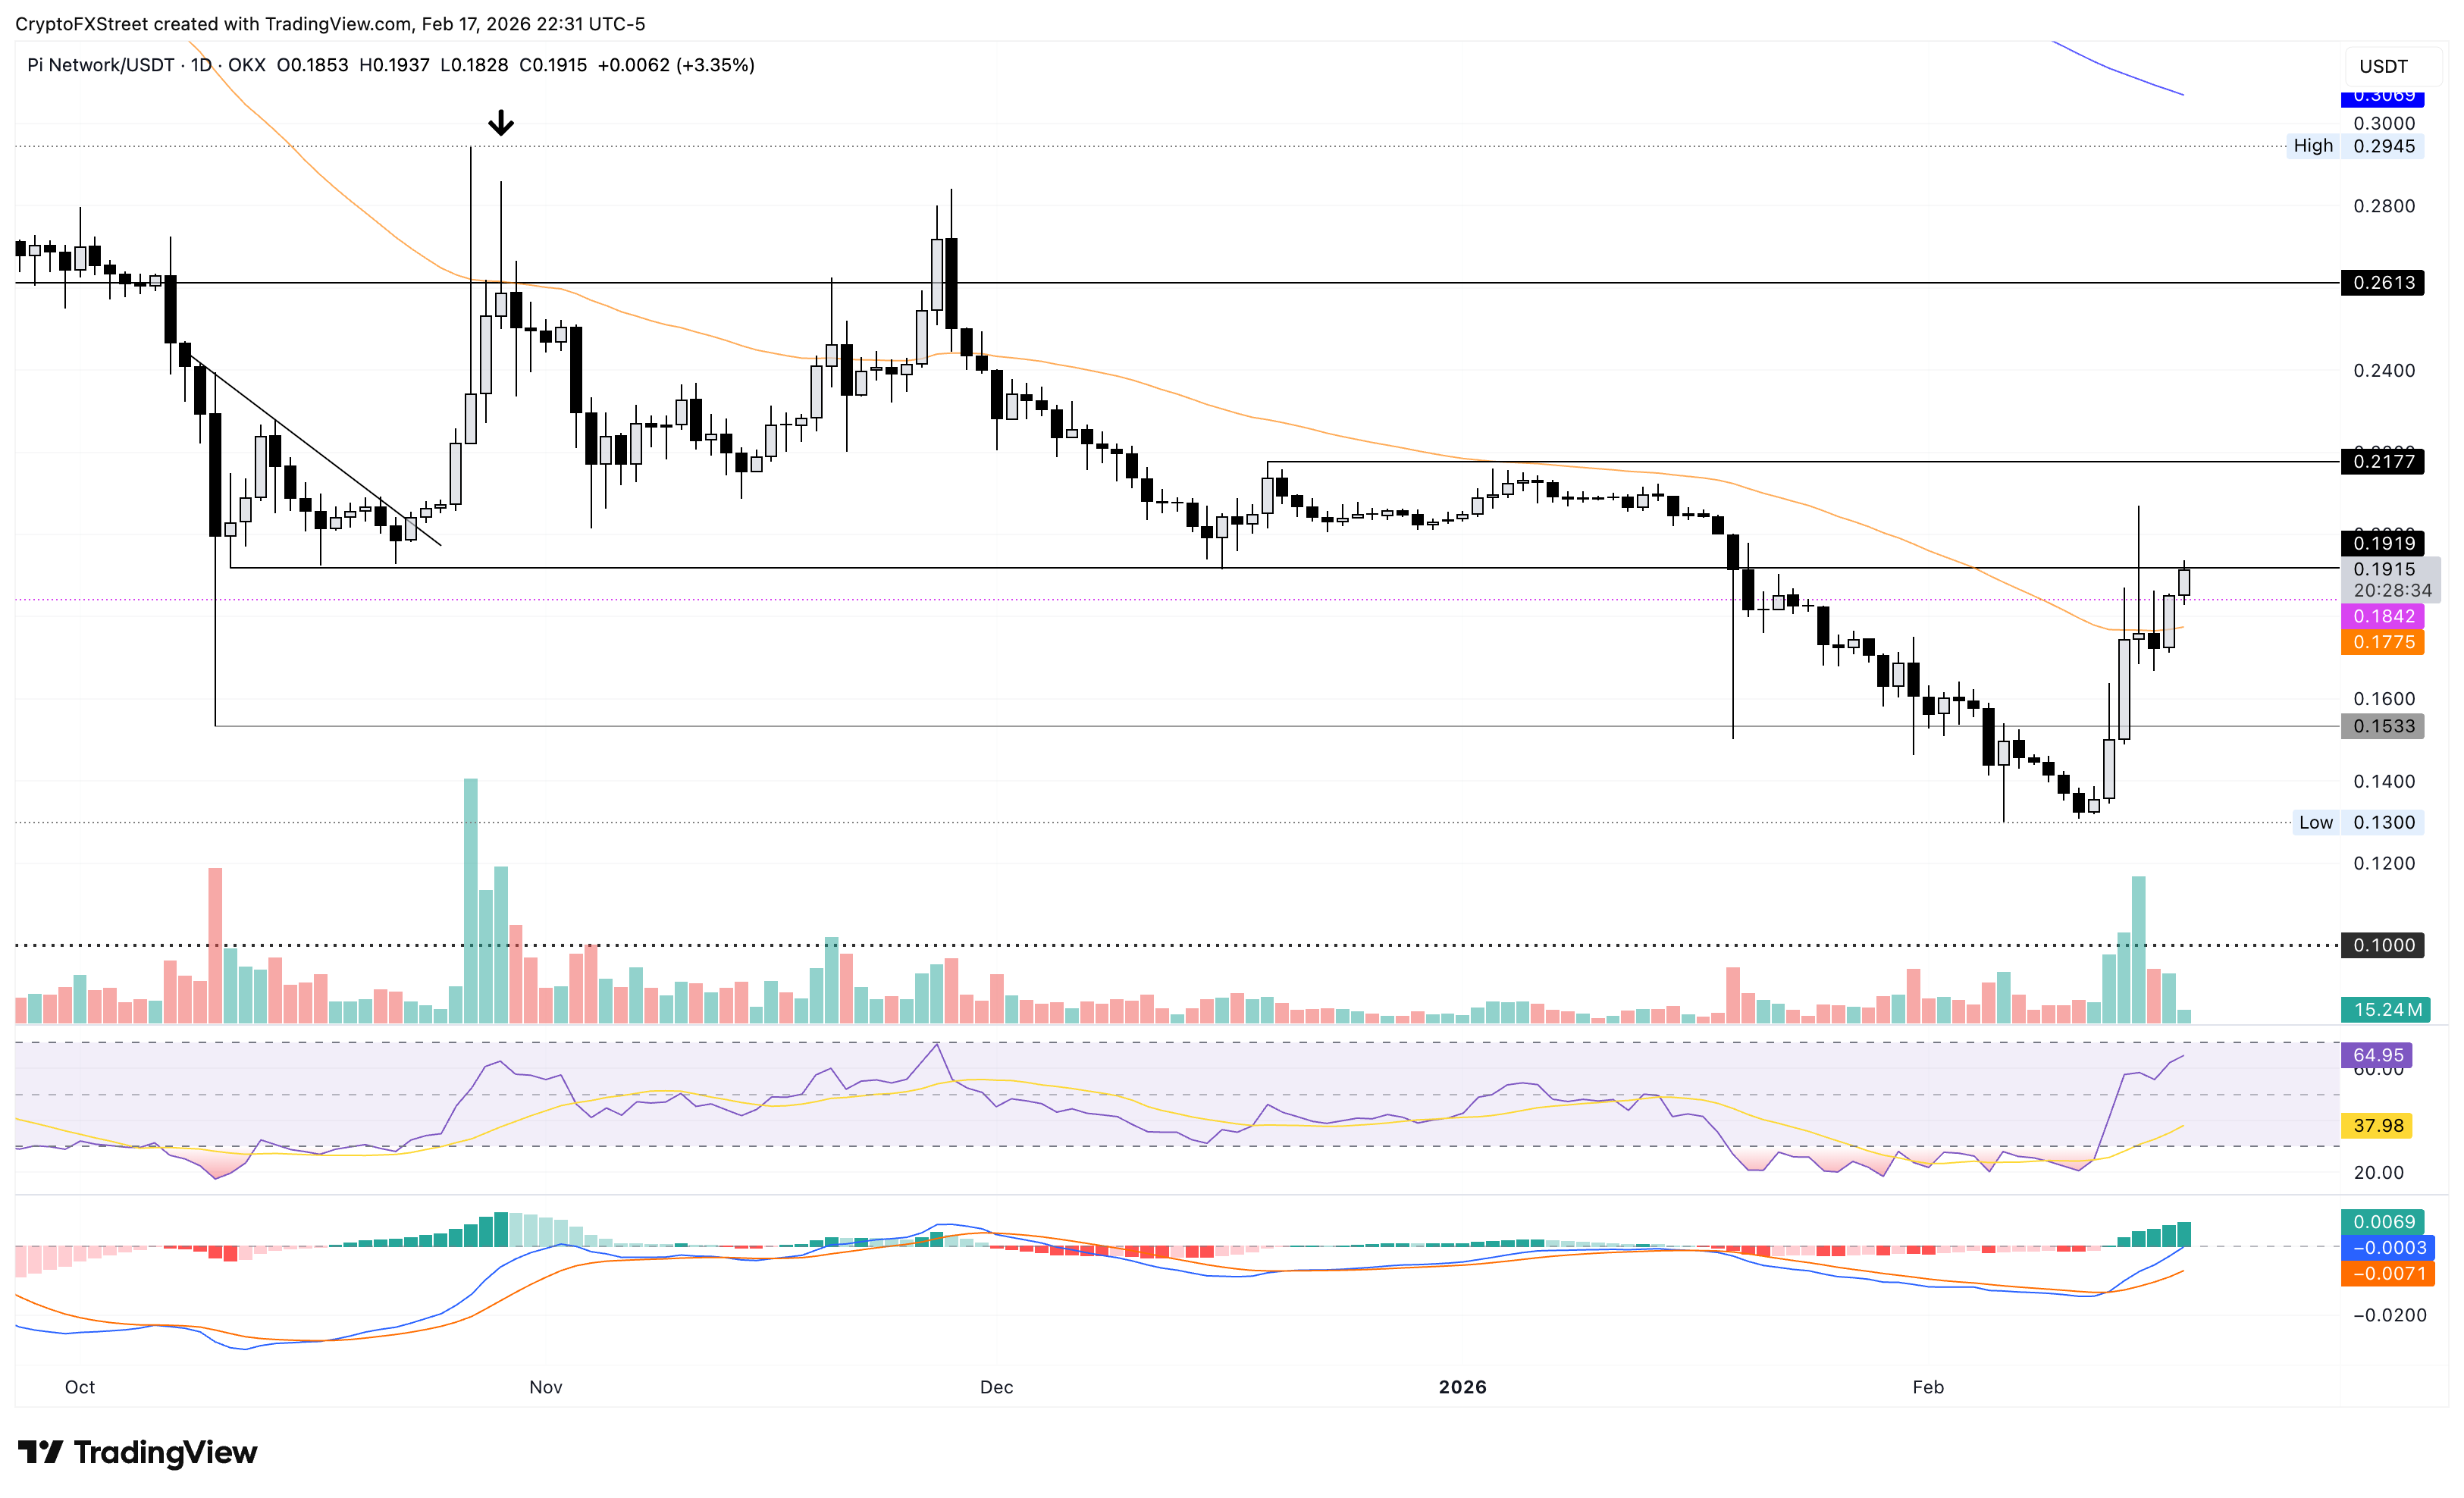
On the downside, the 50-day EMA at $0.1773 remains a key support level, followed by $0.1533, which aligns with the October 10 low.