Decred Price Forecast: DCR rebounds toward key resistance zone on volume spike

- Decred is up more than 7% so far on Friday, approaching the critical resistance zone near $26.
- DCR trading volume has increased by roughly 60% to $6.3 million over the last 24 hours, supporting the intraday recovery.
- Surpassing the key resistance zone, which has capped gains since November, could push Decred above $30.
Decred (DCR) rebounds over 7% at press time on Friday after a three-day decline of almost 14%. Roughly 60% increase in trading volume over the last 24 hours supports the recovery, suggesting heightened spot-market demand. Technically, Decred remains under the shadow of the resistance zone near $26, which has been intact since late November.
Decred takes another breakout attempt at a key resistance zone
CoinMarketCap data show Decred's trading volume is $6.3 million so far on Friday, up 57% in the last 24 hours, consistent with Friday’s recovery and reflecting a buy-side bias among traders.
Technical outlook: Will Decred extend rally above critical resistance?
Decred is trading above $24 at the time of writing on Friday, edging higher after three consecutive days of losses, for over 7% gains so far. The privacy token is trading above the 50-day and 200-day Exponential Moving Averages (EMAs), suggesting a bullish tone.
Still, Decred continues to struggle to surpass the resistance zone near the 38.20% Fibonacci retracement at $26.13, measured from the November 4 high at $70.00 and the December 23 low at $14.21. If Decred clears this zone with a daily close, it could target higher resistances at the 50% and 61.8% Fibonacci retracement levels at $31.54 and $38.07, respectively.
The technical indicators on the daily chart remain mixed, consistent with the fluctuations near the critical resistance zone. The Relative Strength Index (RSI) at 60 shows an upward spike above the midline, suggesting a short-term increase in buying pressure, with further room on the upside before reaching the overbought zone.
However, the Moving Average Convergence Divergence (MACD) has flattened and is at risk of crossing below the signal line, which would reinstate a downward trend. Additionally, contracting green histogram bars indicate a decline in bullish momentum, suggesting further downside for Decred.
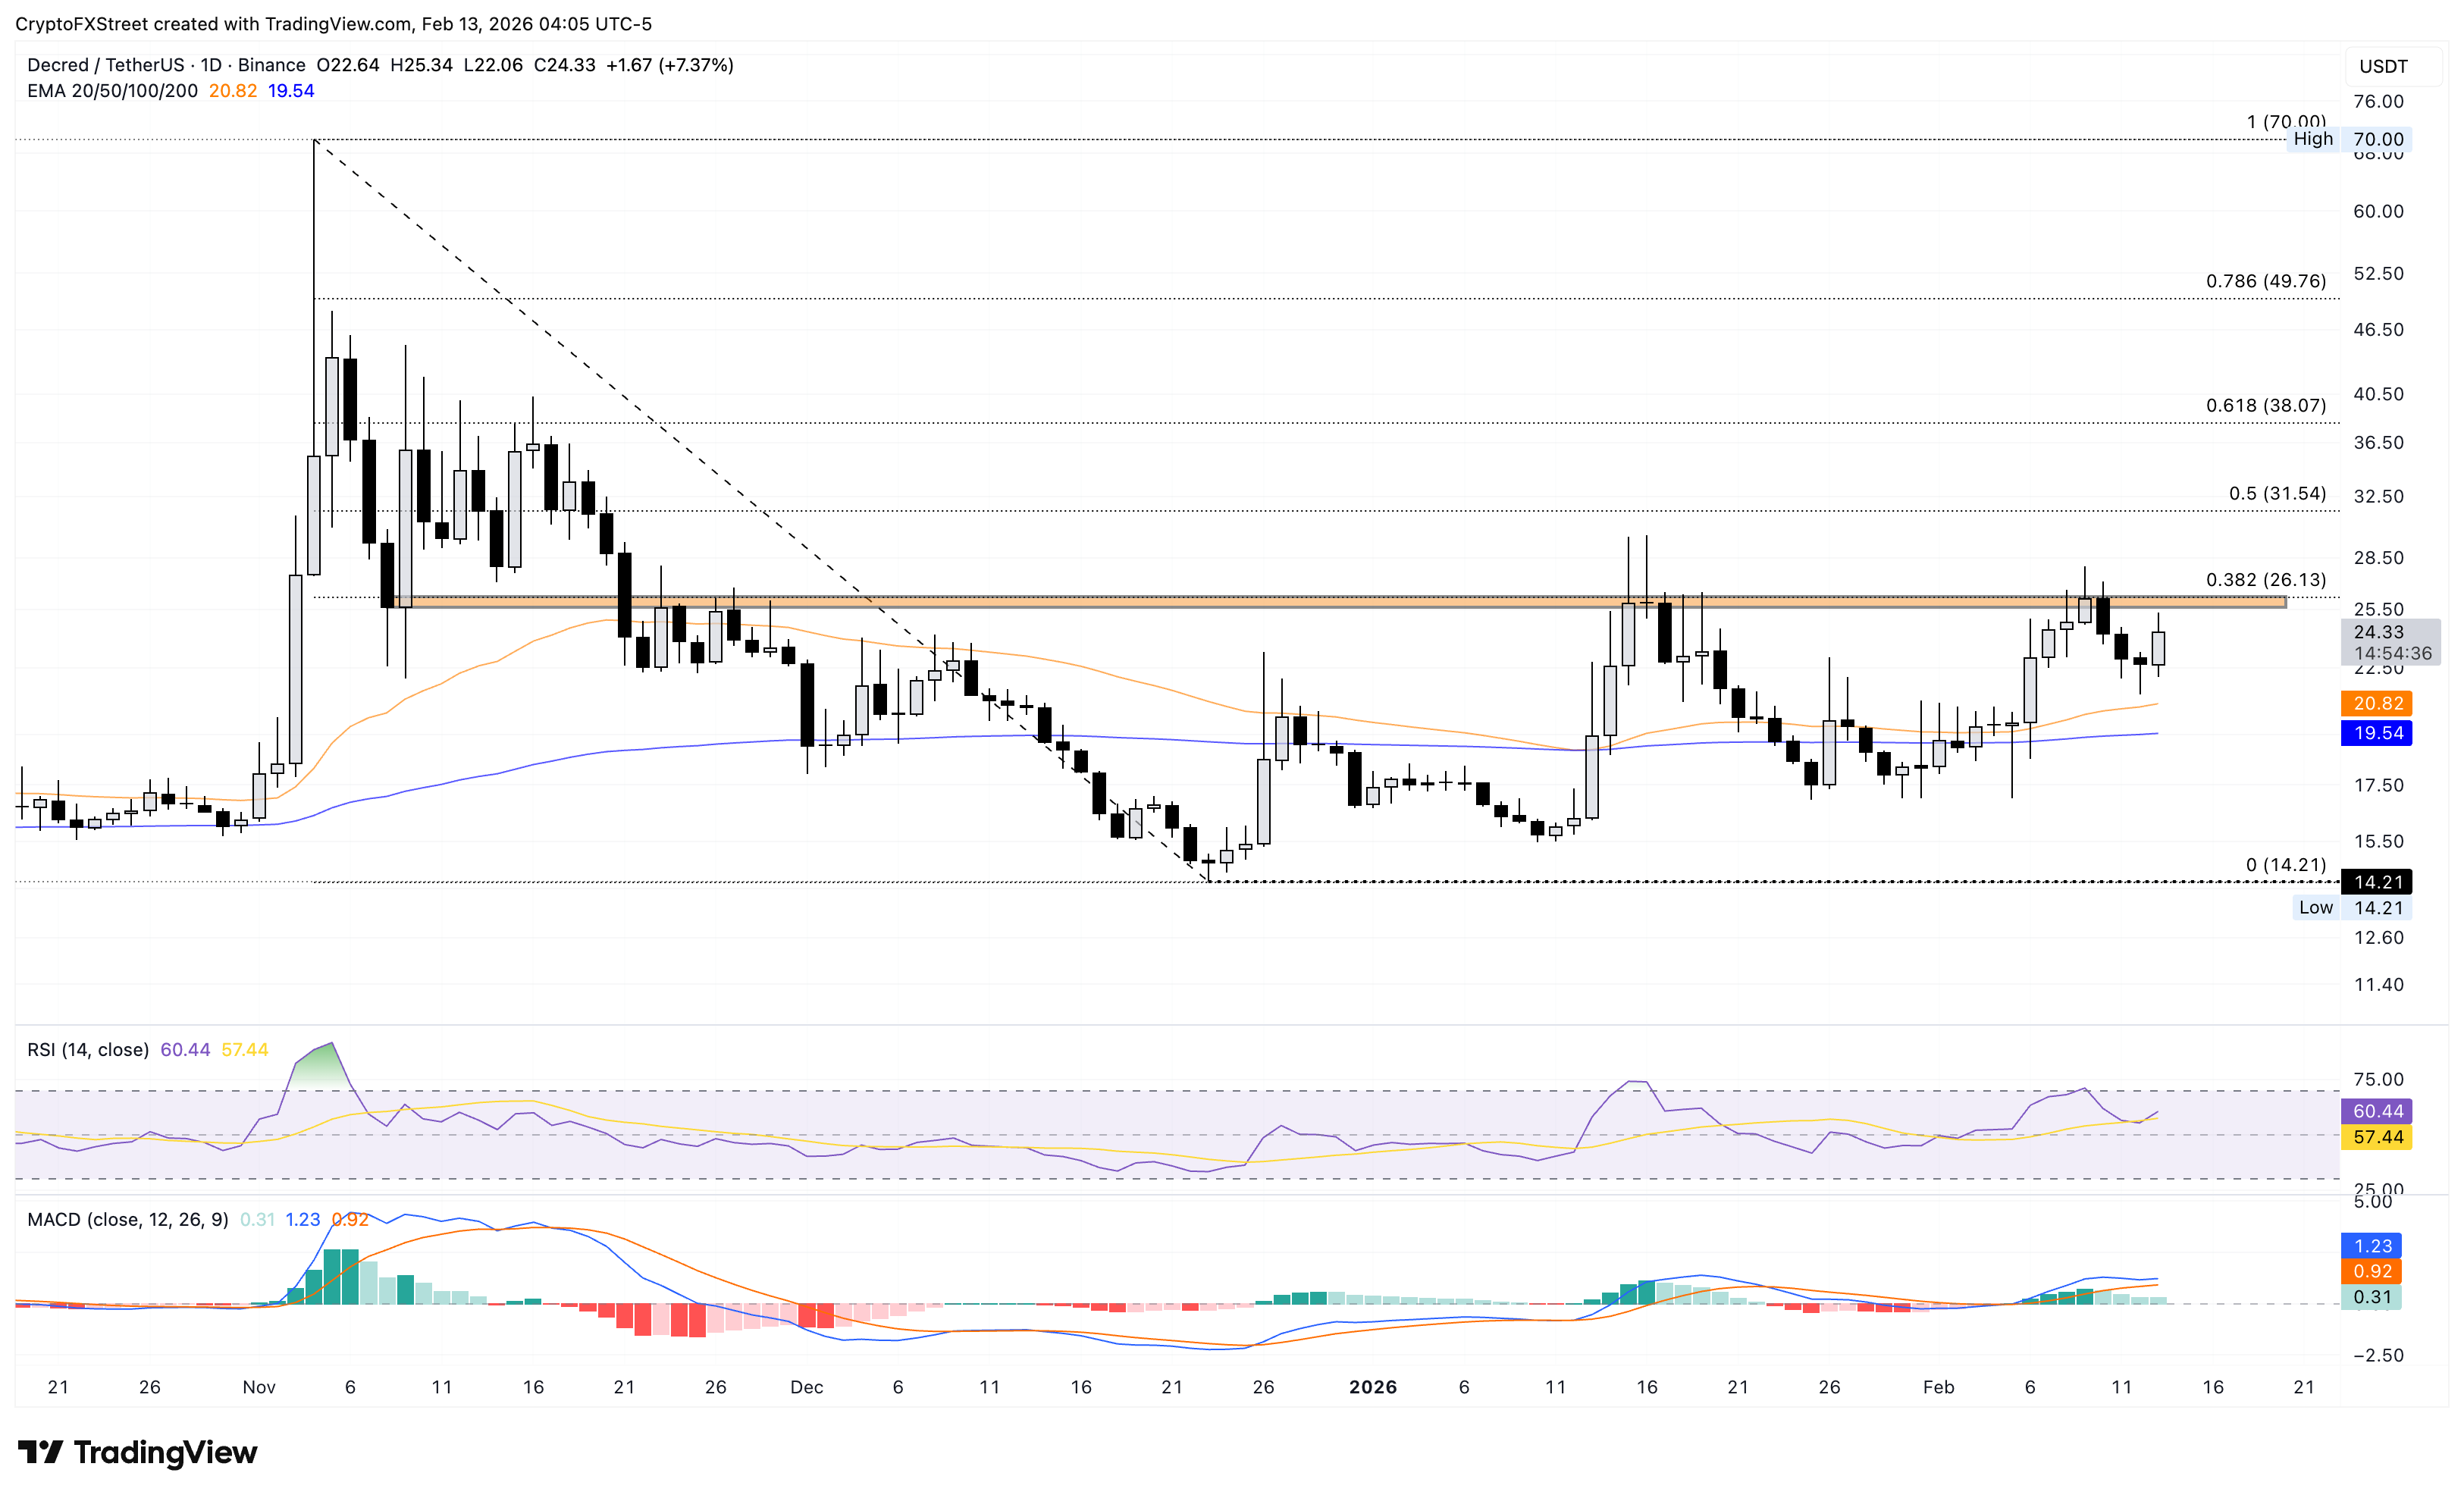
On the downside, the 50-day and 200-day EMAs at $20.82 and $19.54 could serve as initial support levels.
Recommended Articles