

Stellar Price Forecast: XLM risks revisiting $0.136 as sell-off continues

- Stellar price extends its correction on Wednesday, printing the fifth consecutive red daily candle.
- Bearish sentiment strengthens, with short bets rising to the highest level in over a month, alongside declining open interest.
- The technical outlook suggests XLM could revisit $0.136 if the correction persists.
Stellar (XLM) is trading below $0.160 at the time of writing on Wednesday, extending its correction for the fifth consecutive day. The bearish price action is further supported by rising short bets and declining Open Interest (OI) in the derivatives market. At the same time, technical analysis suggests a deeper correction for XLM in the upcoming days.
Derivatives data show a negative outlook
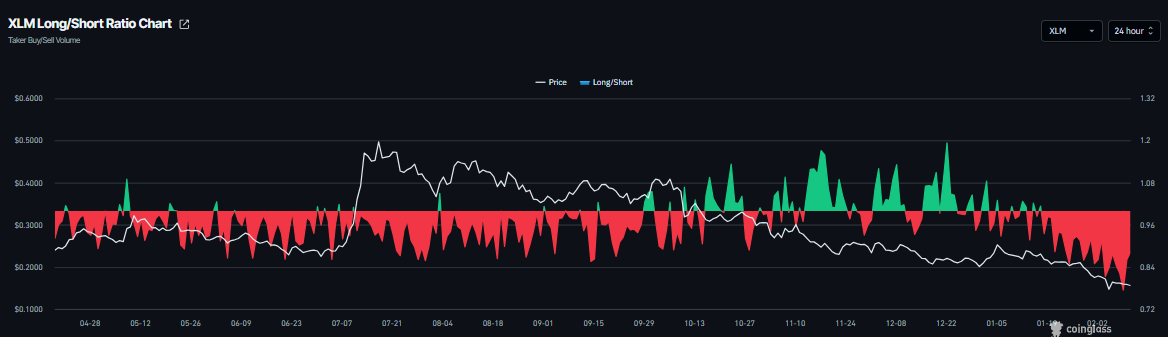
Derivatives data for Stellar support a bearish outlook. XLM’s long-to-short ratio is at 0.77 on Wednesday, the lowest level in over a month. This ratio, being below one, indicates bearish sentiment in the market, as more traders are betting on XLM’s price to fall.
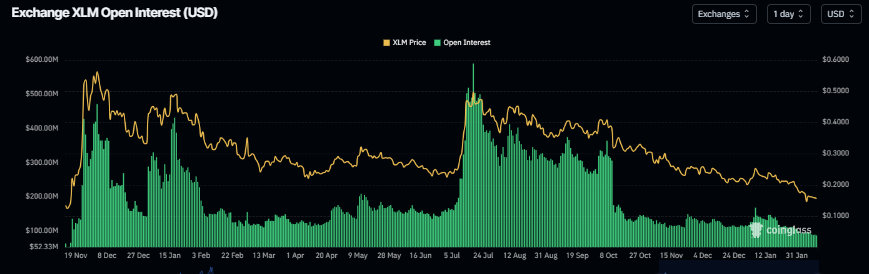
In addition, XLM’s futures Open Interest (OI) drops to $87.07 million on Wednesday, reaching levels not seen since mid-November 2024, and has been steadily falling since the January 6 high of $166.99 million. This drop in OI reflects waning investor participation and projects a bearish outlook.
Stellar Price Forecast: XLM bear's aiming for $0.136 mark
In the daily chart, XLM/USDT trades at $0.155 at the time of writing. The 9-day Simple Moving Average (SMA) slopes lower and sits above Stellar's price, underscoring the persistent bearish bias. Price holds below this gauge, with the SMA at $0.161 acting as near-term resistance. A descending trendline from $0.5285 caps rebounds, with resistance located near $0.203.
The Moving Average Convergence Divergence (MACD) indicator remains below the Signal line and under the zero mark on the same chart, keeping a negative bias. The contracting negative histogram suggests fading bearish momentum. The Relative Strength Index (RSI) sits around 30, near oversold, where a corrective bounce could emerge. A daily close back above the 9-day SMA would open room for an extension toward the trendline resistance, while failure to reclaim it would keep the downside in focus toward Friday's low of $0.136.
(The technical analysis of this story was written with the help of an AI tool.)
Related Articles
Silver Faces Sixth Consecutive Year of Supply Deficit, How Much Upside Is Left in 2026?
TradingKey - According to the 2026 Silver Market Outlook recently released by the Silver Institute, the current robust performance of the silver market remains supported by solid fundamentals. The report indicates that the global silver market is expected to face a structural supply-demand imbalance
Retail Trading Hub Robinhood Sinks Again, Slumping Over 7% After Hours, Signaling Lack of Interest in Crypto?
TradingKey - Robinhood (HOOD) reported a 34% decline in fourth-quarter net profit to $605 million, with total revenue of $1.28 billion missing Wall Street expectations.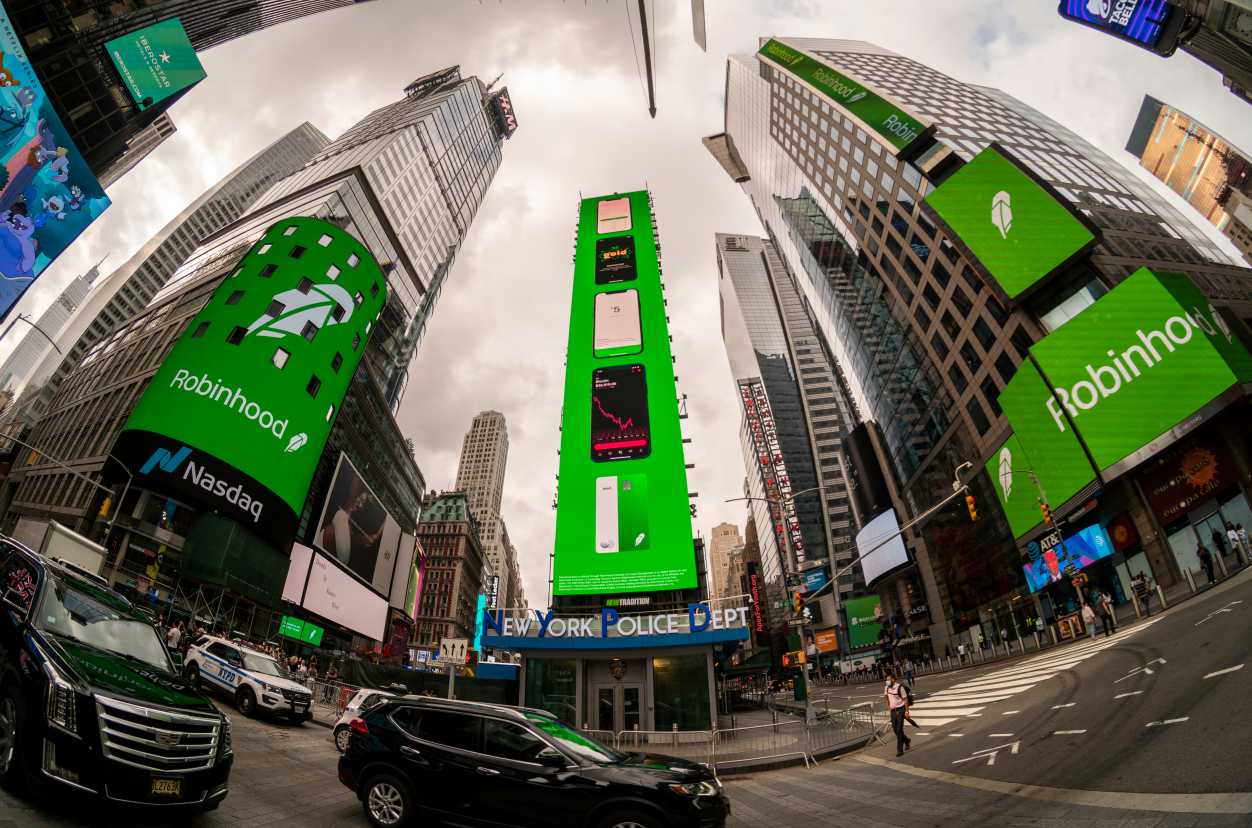
After $20B Debt Sale, Google’s Rare 100-Year Bond Sparks Scrutiny: Has AI Drained the Tech Giant’s Coffers?
TradingKey - According to a Financial Times report, Google parent Alphabet (GOOG)(GOOGL) is planning to issue bonds denominated in British pounds and Swiss francs, which may include the first 100-year GBP bond of this century.
SpaceX IPO Approaching: Will EchoStar Be a Good Buy in 2026?
TradingKey - Today, EchoStar (SATS) is a hybrid story around legacy consumer communications and a high-profile private space play. As a result of its merger with DISH, the company offers satellite TV services and the wireless brand Boost Mobile, in addition to spectrum assets and wholesale network a
Is Bitcoin’s Four-Year Cycle Dead in 2026?
Is the Bitcoin 4-year cycle dead? After 2025 broke historical records with a red post-halving year, institutional analysts explore if the Bitcoin price has decoupled from the halving countdown. Analyze the impact of spot ETFs, global liquidity, and the roadmap to the 2028 halving in this 2026 market
