

Bitcoin slips below $75,000 as selling pressure accelerates

- Bitcoin price slips below $75,000 on Monday, reaching a level not seen in nearly 10 months.
- Momentum indicators continue to deteriorate, signaling strengthening bearish pressure and confirming the weakening technical outlook.
- Technical levels suggest BTC could test the $70,000 psychological support if selling pressure continues.
Bitcoin (BTC) price falls below the $75,000 mark on Monday, having corrected nearly 11% in the previous week and reaching level not seen in nearly 10 months. Market momentum has clearly turned bearish, with technical indicators pointing to further downside toward the next key support at $70,000.
Bitcoin could retest the $70,000 mark if the correction deepens
Bitcoin has extended its decline over 2% at the start of this week on Monday, having corrected more than 11% in the previous one. As of writing on Monday, BTC is trading below $75,000, levels not seen since early April.
If BTC continues its downward trend, it could extend the correction toward the next key psychological level at $70,000.
The Relative Strength Index (RSI) on the daily chart stands near 21, indicating strong bearish momentum and oversold conditions for Bitcoin. Moreover, the Moving Average Convergence Divergence (MACD) indicator showed a bearish crossover on January 20, which remains intact with rising red histogram bars below the neutral level, further supporting the negative outlook.
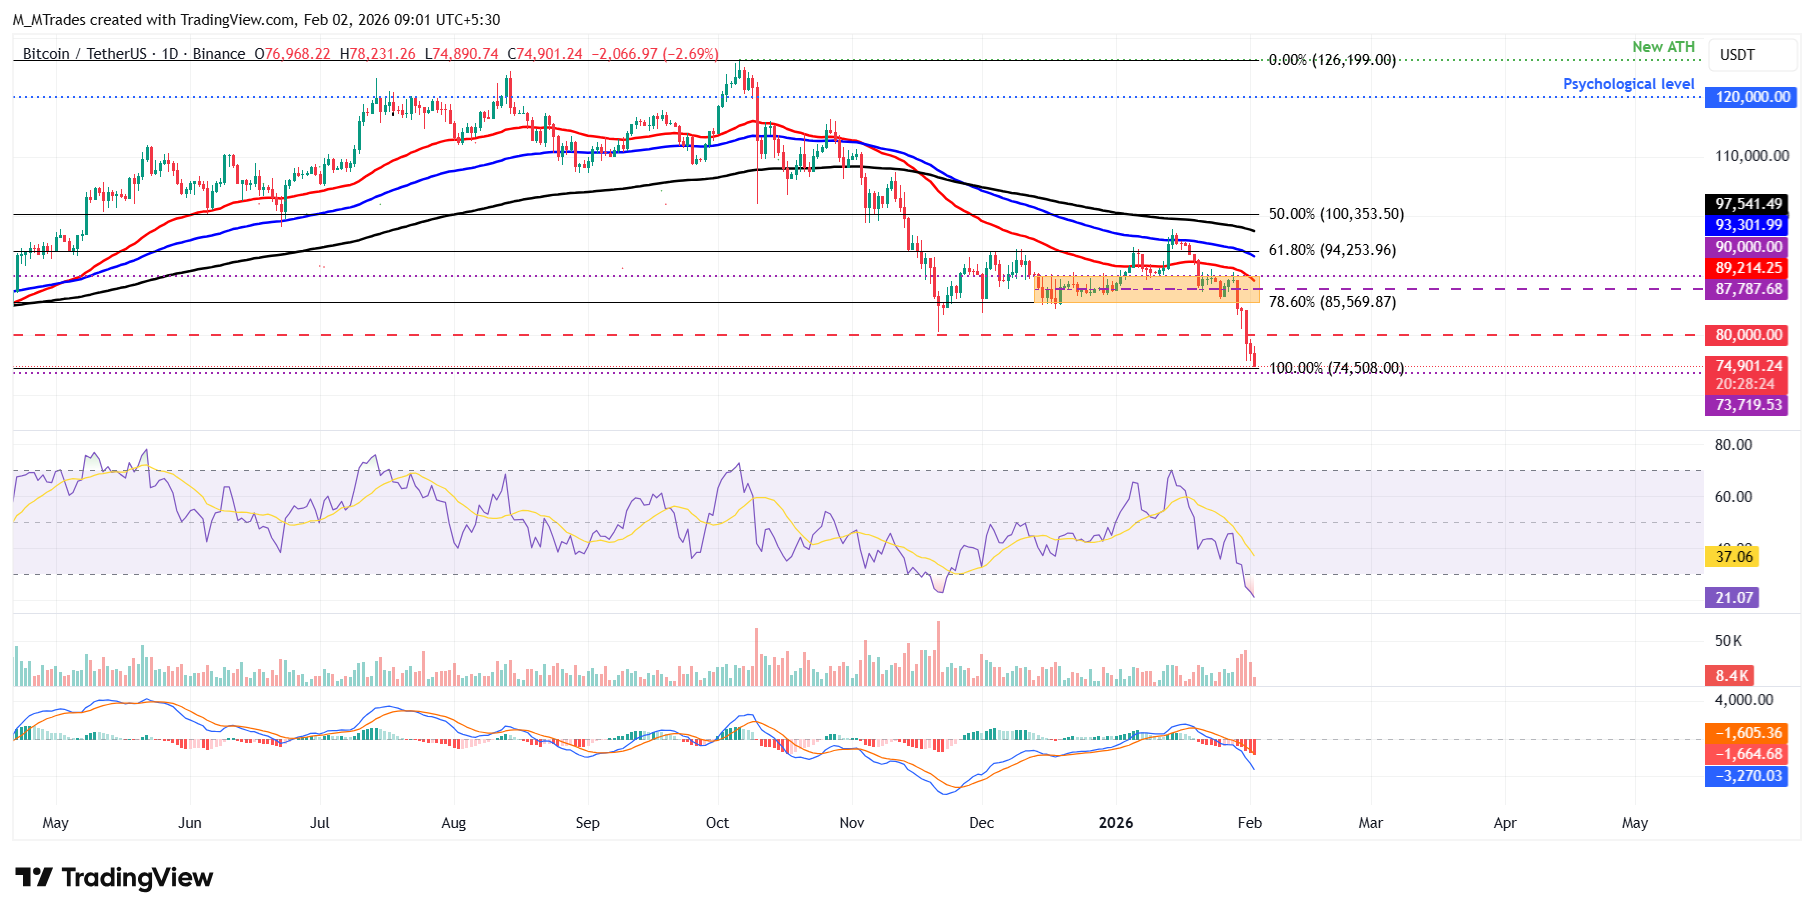
BTC/USDT daily chart
BTC/USDT daily chart
On the other hand, if BTC recovers, it could extend the advance toward the key psychological level at $80,000.
( ... Developing story, please refresh the page for updates...")
Recommended Articles


Comments (0)
Click the $ button, enter the symbol, and select to link a stock, ETF, or other ticker.