


Bitcoin Price Forecast: Continuation Bullish Structure Forms, Bitcoin May Rise to $85,000



AI Podcast


Bitcoin (BTCUSD) is trading near $77,000 after two weeks of correction, showing signs of stabilization. Despite recent net outflows from spot Bitcoin ETFs totaling approximately $1.55 billion since May 15, mid-to-long-term capital remains supportive. Improved macro risk appetite, driven by easing U.S.-Iran tensions and subsequent oil price declines, is benefiting Bitcoin. Technically, a bullish continuation pattern has formed, with $79,500 acting as key short-term resistance. A break above this level could lead to a retest of $85,000, while failure may result in a correction towards $70,000.

TradingKey - On May 25, Eastern Time, Bitcoin ( BTCUSD) fluctuated near $77,000, with prices showing signs of stabilizing after two consecutive weeks of correction. Despite recent persistent outflows from Bitcoin ETFs, Bitcoin prices may be poised for a rally as macro risk appetite recovers.
ETF flows show net outflows, but risk appetite improves.
The primary upward pressure on Bitcoin currently stems from the sustained capital outflows from spot Bitcoin ETFs. According to CoinGlass data, spot Bitcoin ETFs have recorded net outflows for six consecutive trading days since May 15, with a cumulative net outflow of approximately $1.55 billion.
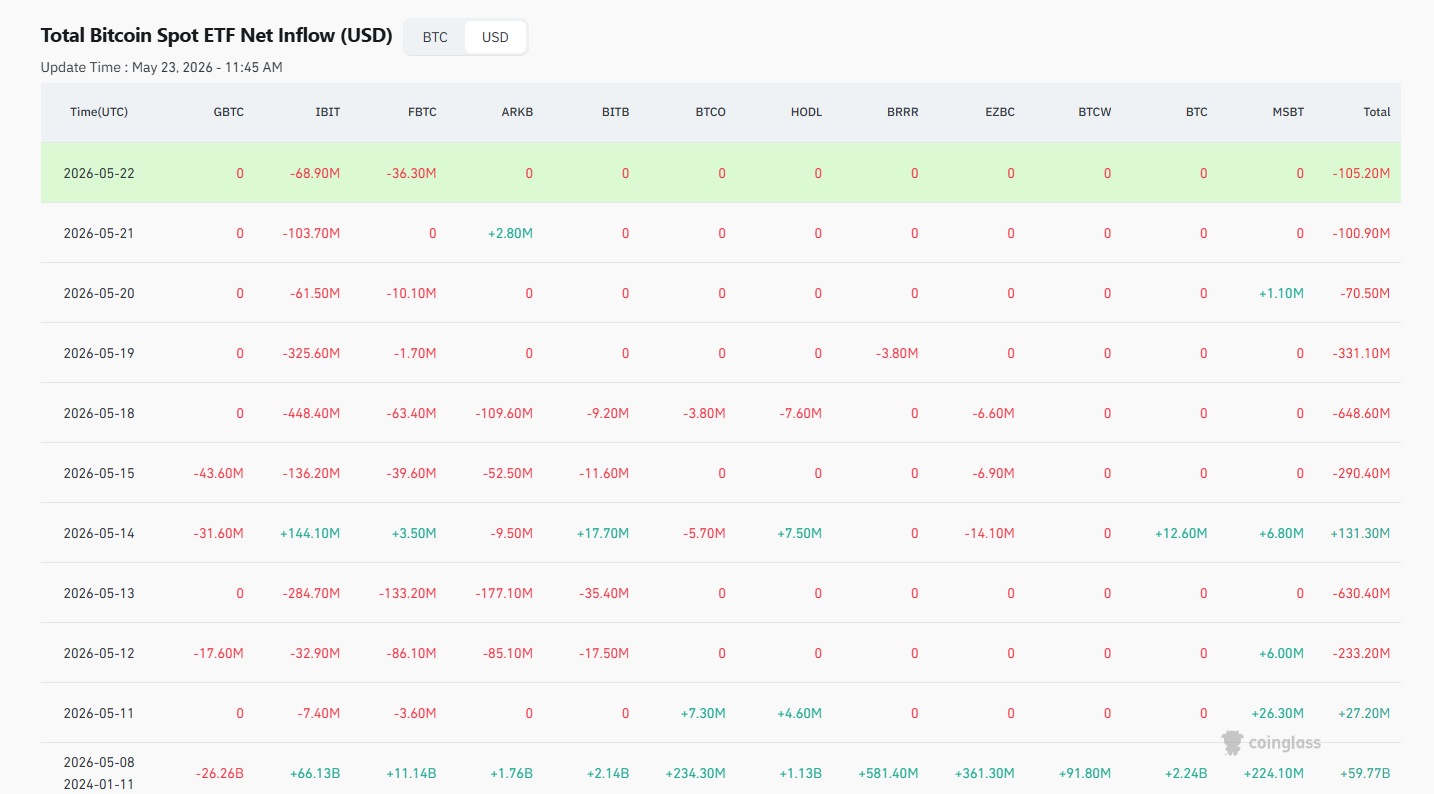
Bitcoin capital flow data, source: CoinGlass
However, the liquidity situation has not worsened unilaterally. Bitcoin did not continue to break lower following a two-week correction, indicating that mid-to-long-term capital remains supportive at lower levels. Market sentiment is likely in a wait-and-see mode; if ETF capital flows return to a net inflow, Bitcoin could potentially challenge the $85,000 mark again, whereas continued outflows could limit any rebound.
From a macro perspective, Bitcoin sentiment has recently seen some recovery, primarily driven by expectations of an easing in U.S.-Iran tensions. Latest developments show President Trump stating that a ceasefire and peace arrangement involving Iran has been "largely negotiated," with core objectives including ending the conflict, reopening the Strait of Hormuz, and advancing subsequent nuclear talks.
Impacted by the news, oil prices gapped lower at Monday's open and continued to trend down, with WTI ( USOIL) crude prices falling more than 6% intraday, and Brent crude prices also dropping over 6%, while gold ( XAUUSD) prices gapped higher and trended upwards, and Bitcoin prices maintained their gains intraday. Market performance indicates that as oil prices retreated, market risk appetite improved.
Technical Analysis: Bullish continuation pattern forms as $79,500 becomes key short-term resistance for bulls.
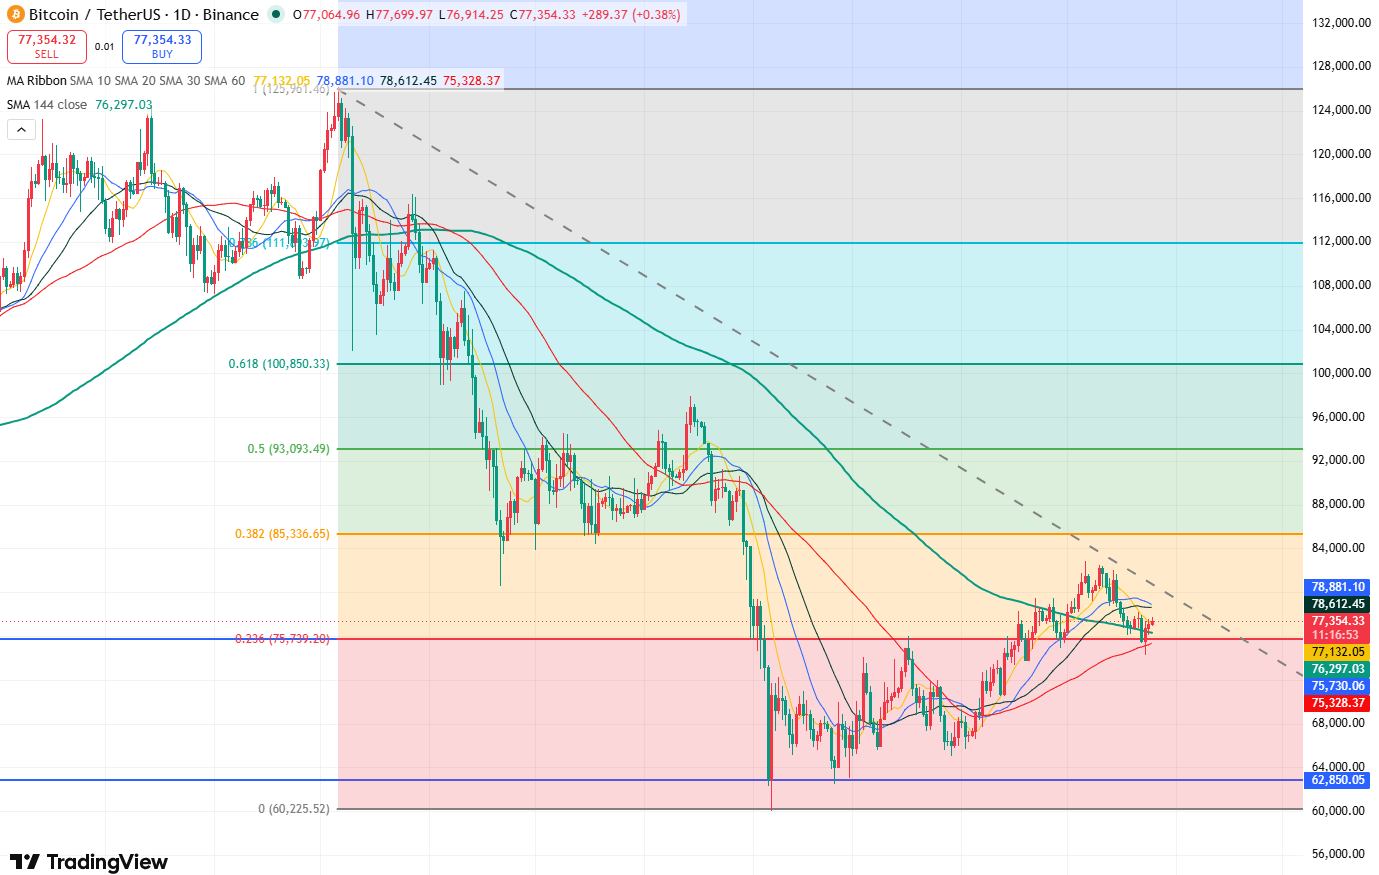
Bitcoin daily price chart, source: TradingView
Based on the Bitcoin daily chart, the price broke out of the $63,000-$75,000 bottom range on April 17, subsequently rallying toward the $85,000 resistance level before retreating to a low of $74,289.60 on May 23. Notably, the closing price that day was $76,752.01, remaining above $75,000. This indicates that Bitcoin's candlestick structure has formed a bullish continuation pattern—a breakout followed by a retest to confirm support—significantly boosting short-term bullish momentum.
Currently, the immediate resistance level for Bitcoin is $79,500. A break above this level would clear the path for an advance toward $85,000; otherwise, if the price remains capped by this resistance, Bitcoin could enter a deeper correction phase, potentially testing the $70,000 psychological level.
This content was translated using AI and reviewed for clarity. It is for informational purposes only.
Recommended Articles












Comments (1)
Click the $ button, enter the symbol, and select to link a stock, ETF, or other ticker.