Crypto Today: Bitcoin and XRP stabilize while Ethereum faces resistance ahead of the Fed monetary policy decision

- Bitcoin clings to $89,000 as recovery stalls prior to the Fed decision on monetary policy.
- Ethereum slides toward $3,000 support amid intensifying headwinds from profit-taking and macroeconomic uncertainty.
- XRP steadies as buyers target a breakout above the 50-day exponential moving average.
Bitcoin (BTC) is declining but remains above immediate support at $89,000 at the time of writing on Wednesday, as investors tread cautiously ahead of the United States (US) Federal Reserve’s (Fed) monetary policy decision.
Ethereum (ETH) continues to face headwinds, sliding below $3,000 from an intraday high of $3,039, amid persistent profit-taking and broader macroeconomic uncertainty. Meanwhile, Ripple (XRP) has demonstrated relative strength, holding above $1.90 support as bulls attempt to breach the next supply zone around $2.00.
Caution ahead of Fed’s monetary policy decision
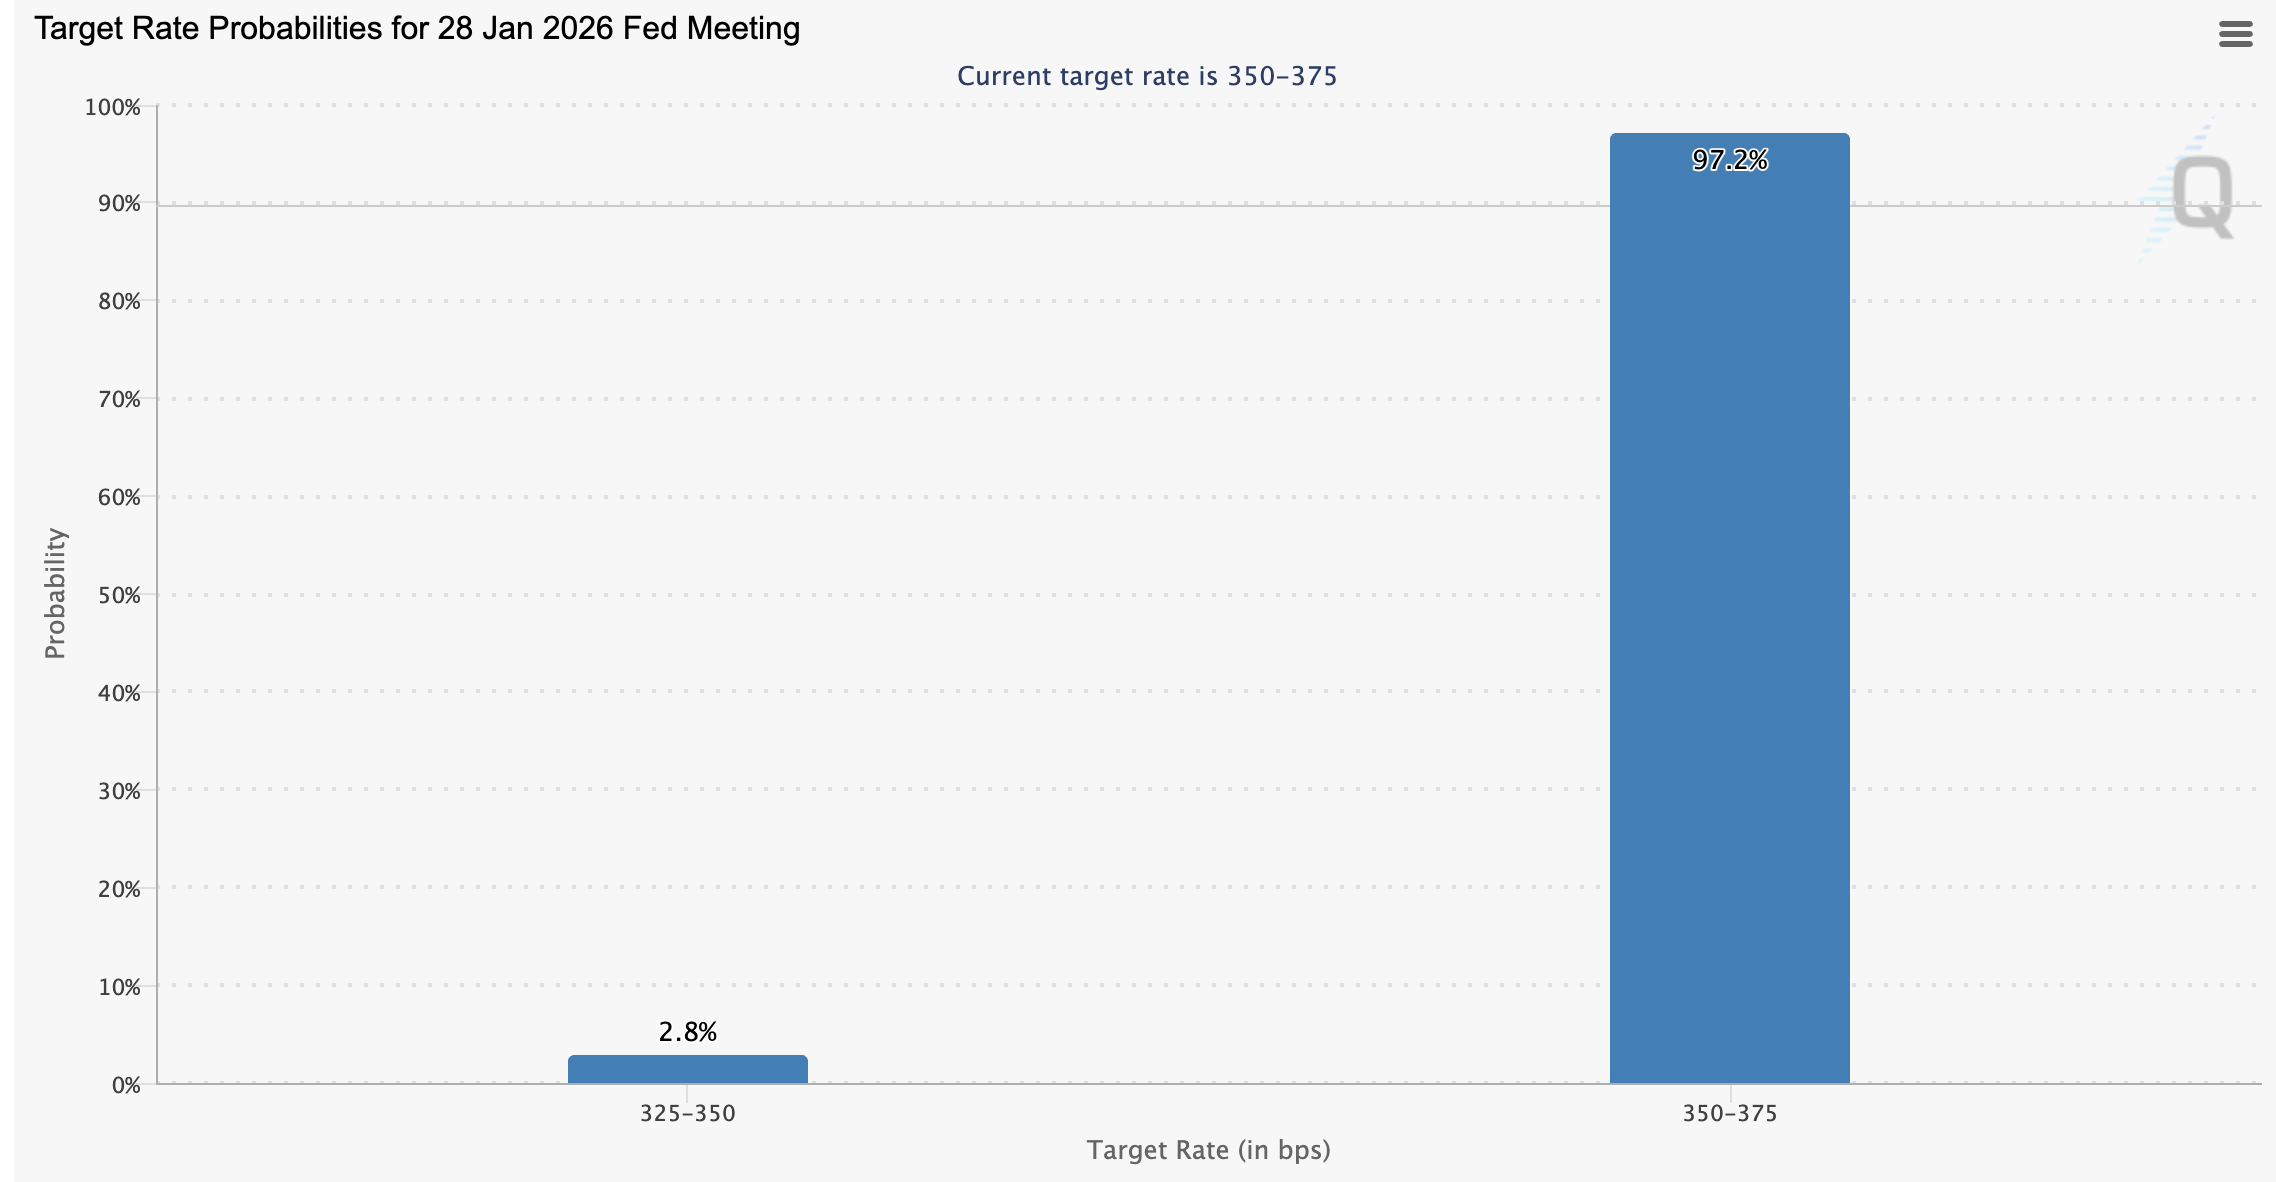
The Fed is widely expected to maintain the federal funds rate at the 3.50%–3.75% target range during its Wednesday meeting, pausing its monetary easing cycle following three consecutive interest rate cuts in 2025 that reduced borrowing costs to their lowest level since early 2023.
CME Group’s FedWatch tool shows that investors are continuing to price in a 97.2% chance that the central bank will leave rates unchanged, with only 2.8% of market participants expecting a cut down to the range of 3.25%–3.50%.
Interest rate cuts act as a catalyst for high-risk assets such as Bitcoin and altcoins to rally, while keeping rates tight keeps liquidity constrained.
US President Donald Trump has been urging Fed Chair Jerome Powell to aggressively reduce borrowing costs, however, monetary policymakers have insisted on responding to current market conditions and data. The central bank is often caught in the crosshairs of its dual mandate to bring inflation down to 2% target and reduce unemployment.
Job growth in the US has slowed sharply in recent months, while the Unemployment Rate has stabilized. However, with inflation above the 2% target, policymakers may signal an extended pause in the monetary easing cycle. Investors will be watching closely the Fed's decision and Powell's press conference for hints on the potential timing of the next rate cut.
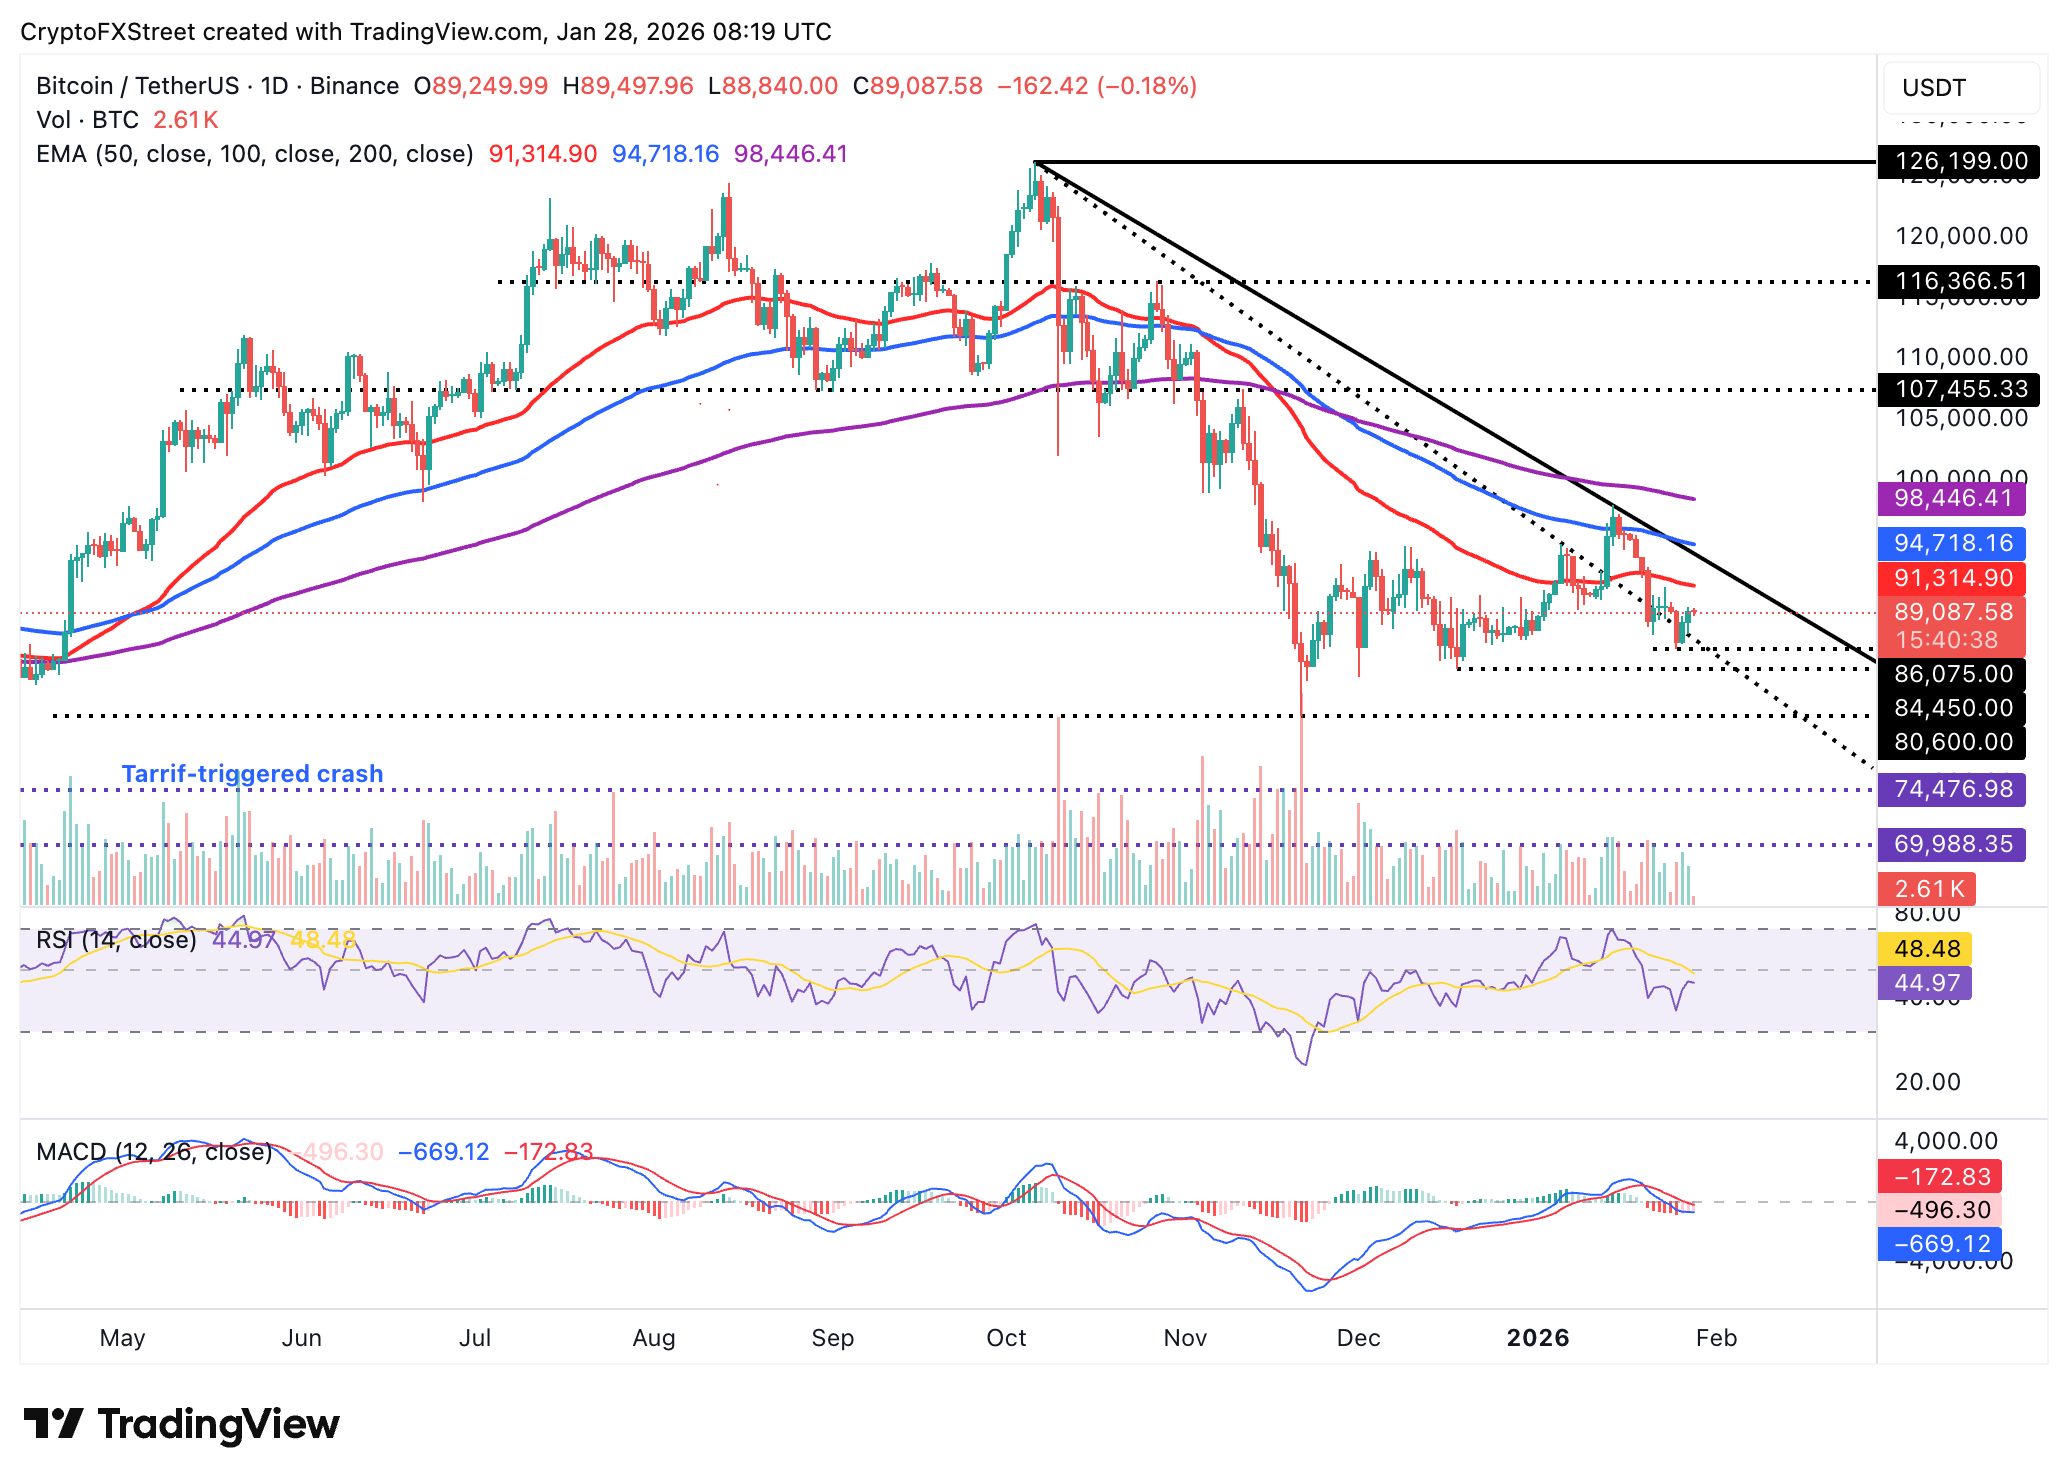
Chart of the day: Bitcoin holds key support
Bitcoin is stable above the $89,000 support as investors navigate the market ahead of the Fed event. The Relative Strength Index (RSI) is flat at 45 on the daily chart, emphasising the ongoing sideways trading.
Traders will watch closely for the RSI to extend above the midline, potentially marking a transition from bearish to bullish. Also, such a move would increase the odds of an extended breakout above the $90,000 pivotal level.
The 50-day Exponential Moving Average (EMA) highlights resistance at $91,315, which should be weakened for Bitcoin to extend its recovery toward the 100-day EMA at $94,718.
Still, the Moving Average Convergence Divergence (MACD) indicator remains below its signal line on the same chart, suggesting that bearish momentum may build up if investors reduce risk exposure. A reversal below $89,000, the immediate support, may push BTC to test Sunday’s low at $86,075.
Altcoins technical outlook: Ethereum faces headwinds as XRP steadies
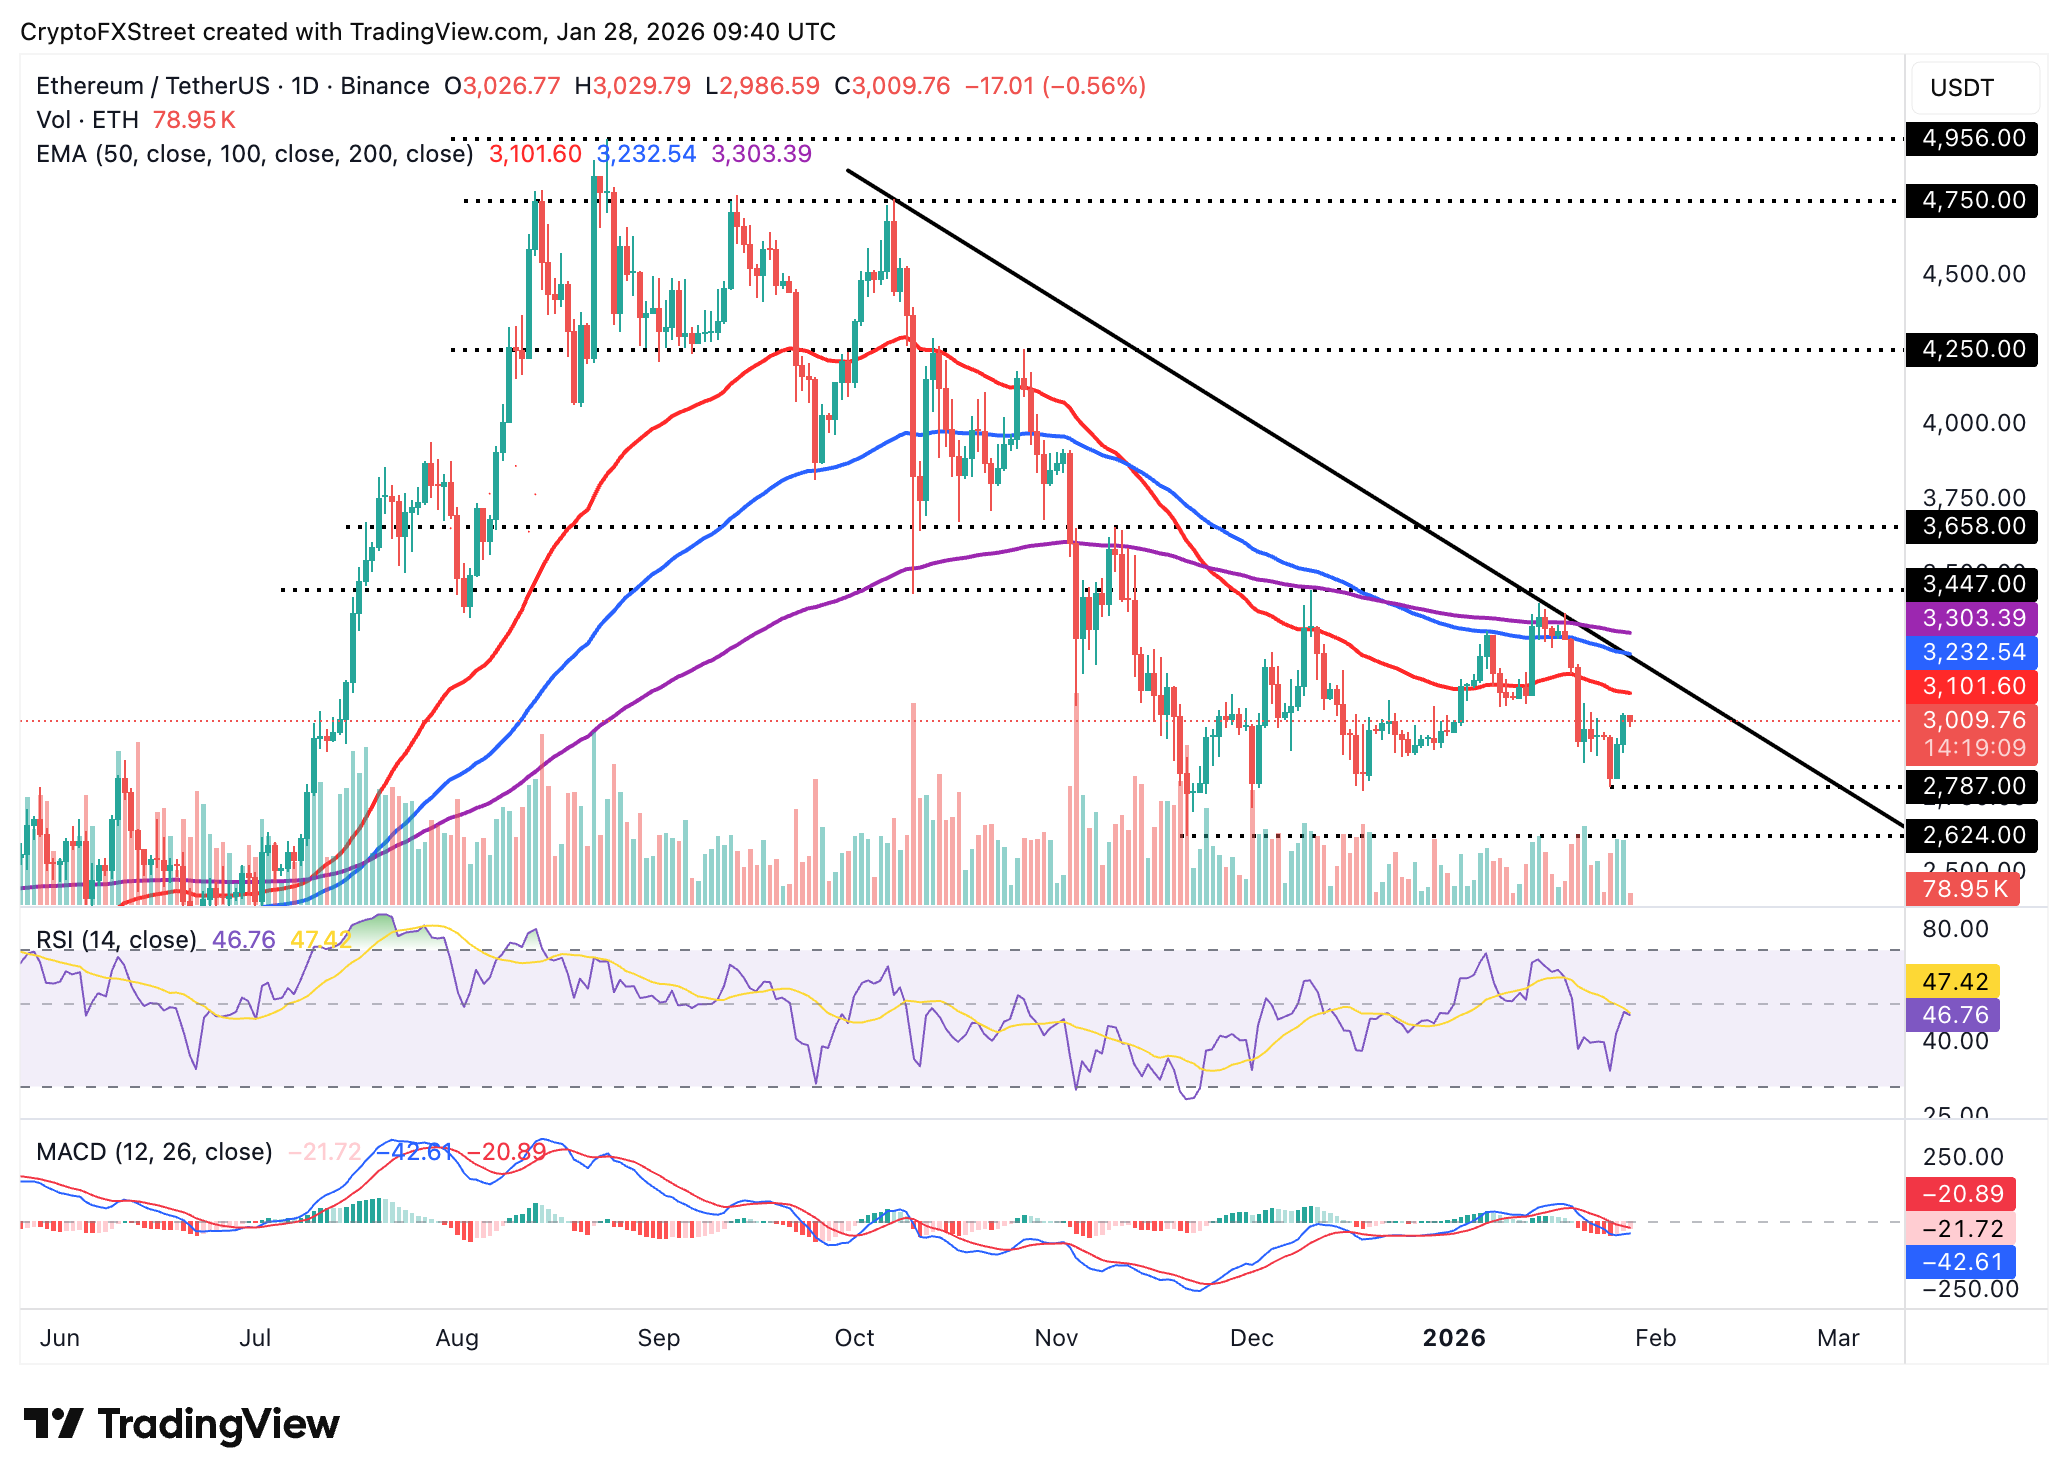
The second-largest cryptocurrency by market capitalization, Ethereum, has declined from an intraday high of $3,039 and currently holds above support at $3,000, suggesting early profit-taking and macroeconomic risks ahead of the Fed’s monetary policy decision.
Technical indicators indicate ETH is testing critical support levels, with the 50-day EMA at $3,102 serving as a key battleground for bulls and bears. The RSI fell short of the midline and currently sits at 47 on the daily chart, suggesting that bearish momentum could persist.
A decisive break above the midline would point the RSI toward overbought territory and increase the chances of a stronger recovery, targeting the 100-day EMA at $3,233 and the 200-day EMA at $3,303.
However, the MACD indicator on the same chart remains below its signal line, suggesting investors may reduce exposure, further adding to selling pressure. A reversal below the $3,000 level could push ETH downward toward Tuesday’s low at $2,900.
As for XRP, bulls are relentless in their push for a break above the 50-day EMA at $2.02. If the cross-border remittance token stays above support at $1.90 as the RSI on the daily chart rises to 45, the path of least resistance would remain upward.
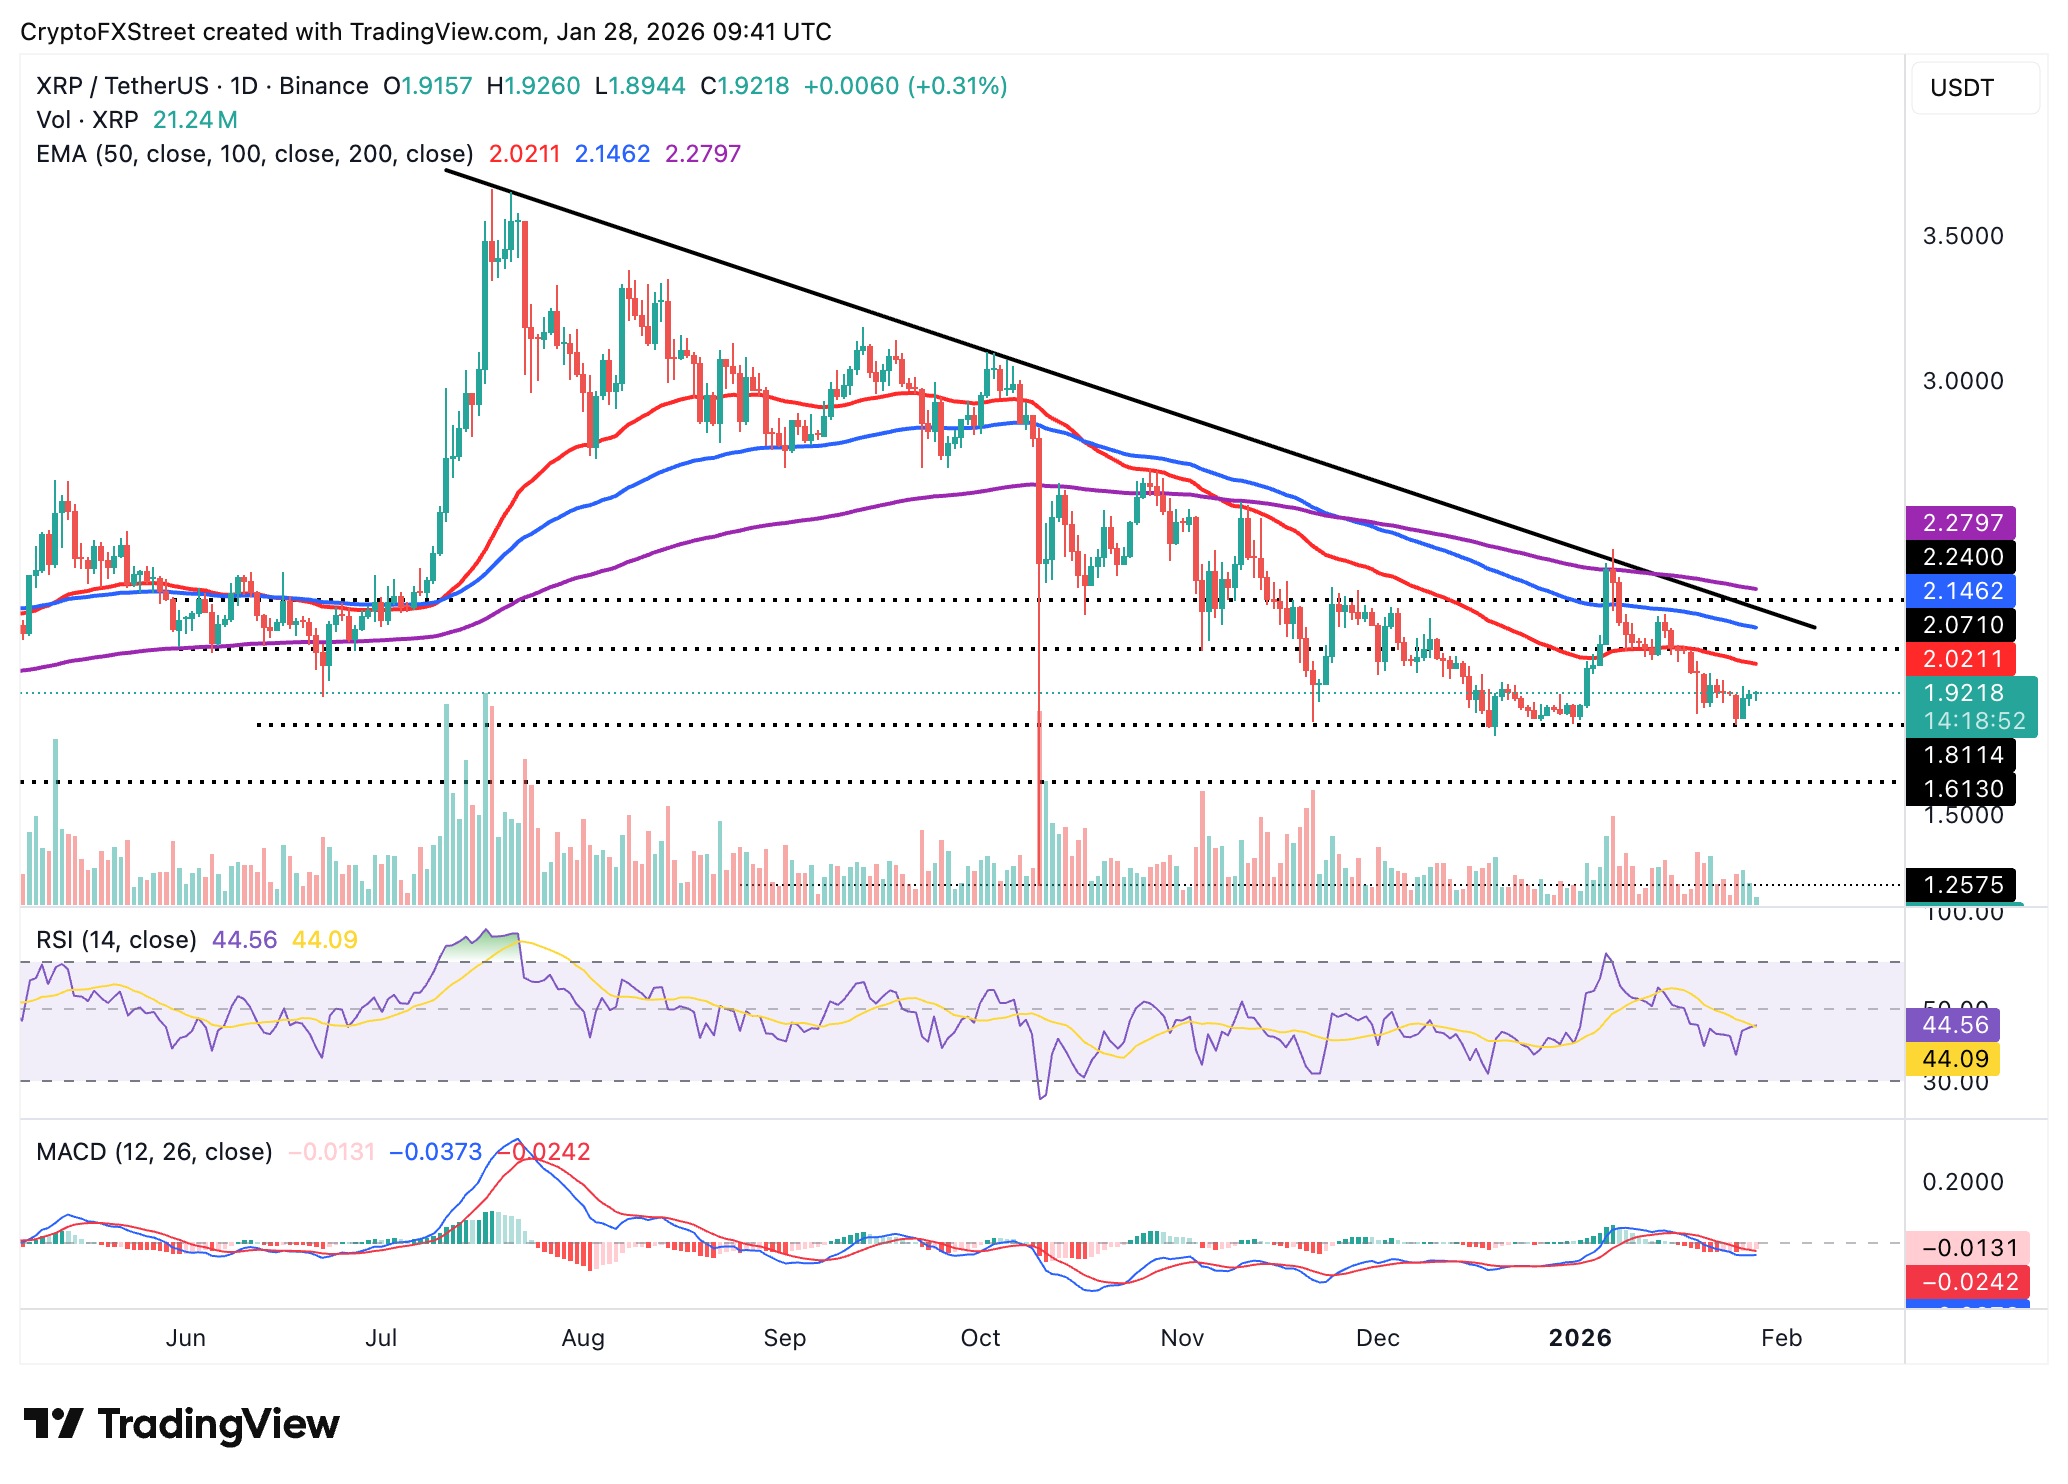
Traders will watch for the MACD indicator to cross above the signal line, gesturing a buy on XRP and anticipating an extended rebound above $2.00. However, the histogram below the zero line leans toward risk, suggesting caution. The next key support lies at $1.81, tested on Sunday and April’s low at $1.61.
Cryptocurrency prices FAQs
Token launches influence demand and adoption among market participants. Listings on crypto exchanges deepen the liquidity for an asset and add new participants to an asset’s network. This is typically bullish for a digital asset.
A hack is an event in which an attacker captures a large volume of the asset from a DeFi bridge or hot wallet of an exchange or any other crypto platform via exploits, bugs or other methods. The exploiter then transfers these tokens out of the exchange platforms to ultimately sell or swap the assets for other cryptocurrencies or stablecoins. Such events often involve an en masse panic triggering a sell-off in the affected assets.
Macroeconomic events like the US Federal Reserve’s decision on interest rates influence crypto assets mainly through the direct impact they have on the US Dollar. An increase in interest rate typically negatively influences Bitcoin and altcoin prices, and vice versa. If the US Dollar index declines, risk assets and associated leverage for trading gets cheaper, in turn driving crypto prices higher.
Halvings are typically considered bullish events as they slash the block reward in half for miners, constricting the supply of the asset. At consistent demand if the supply reduces, the asset’s price climbs.