

Meme Coins Price Prediction: Dogecoin, Shiba Inu, Pepe face downside risks

- Dogecoin consolidates above $0.1200 after losing over 4% so far this week.
- Shiba Inu hovers near a crucial support level as selling pressure eases.
- Pepe flashes downside risk below a crucial psychological support after a 4% drop on Thursday.
Meme coins, including Dogecoin (DOGE), Shiba Inu (SHIB), and Pepe (PEPE), are dragging on Friday amid the broader decline, risking further downside. The technical outlook for the meme coins remains bearish after a losing week.
Dogecoin drags after its downfall
Dogecoin is up nearly 1% at press time on Friday, consolidating above $0.1200 after a drop of over 4% so far this week. The meme coin trades below the declining 50-day and 200-day Exponential Moving Averages (EMAs), reinforcing the bearish bias.
If DOGE slips below the $0.1161 support marked by the December 31 low, it would risk further downside toward the October 10 low at $0.0950.
The technical indicators on the daily chart corroborate the downside bias, as the Relative Strength Index (RSI) at 40 remains below the midline, and the Moving Average Convergence Divergence (MACD) sustains the sell signal and crosses below the zero line.
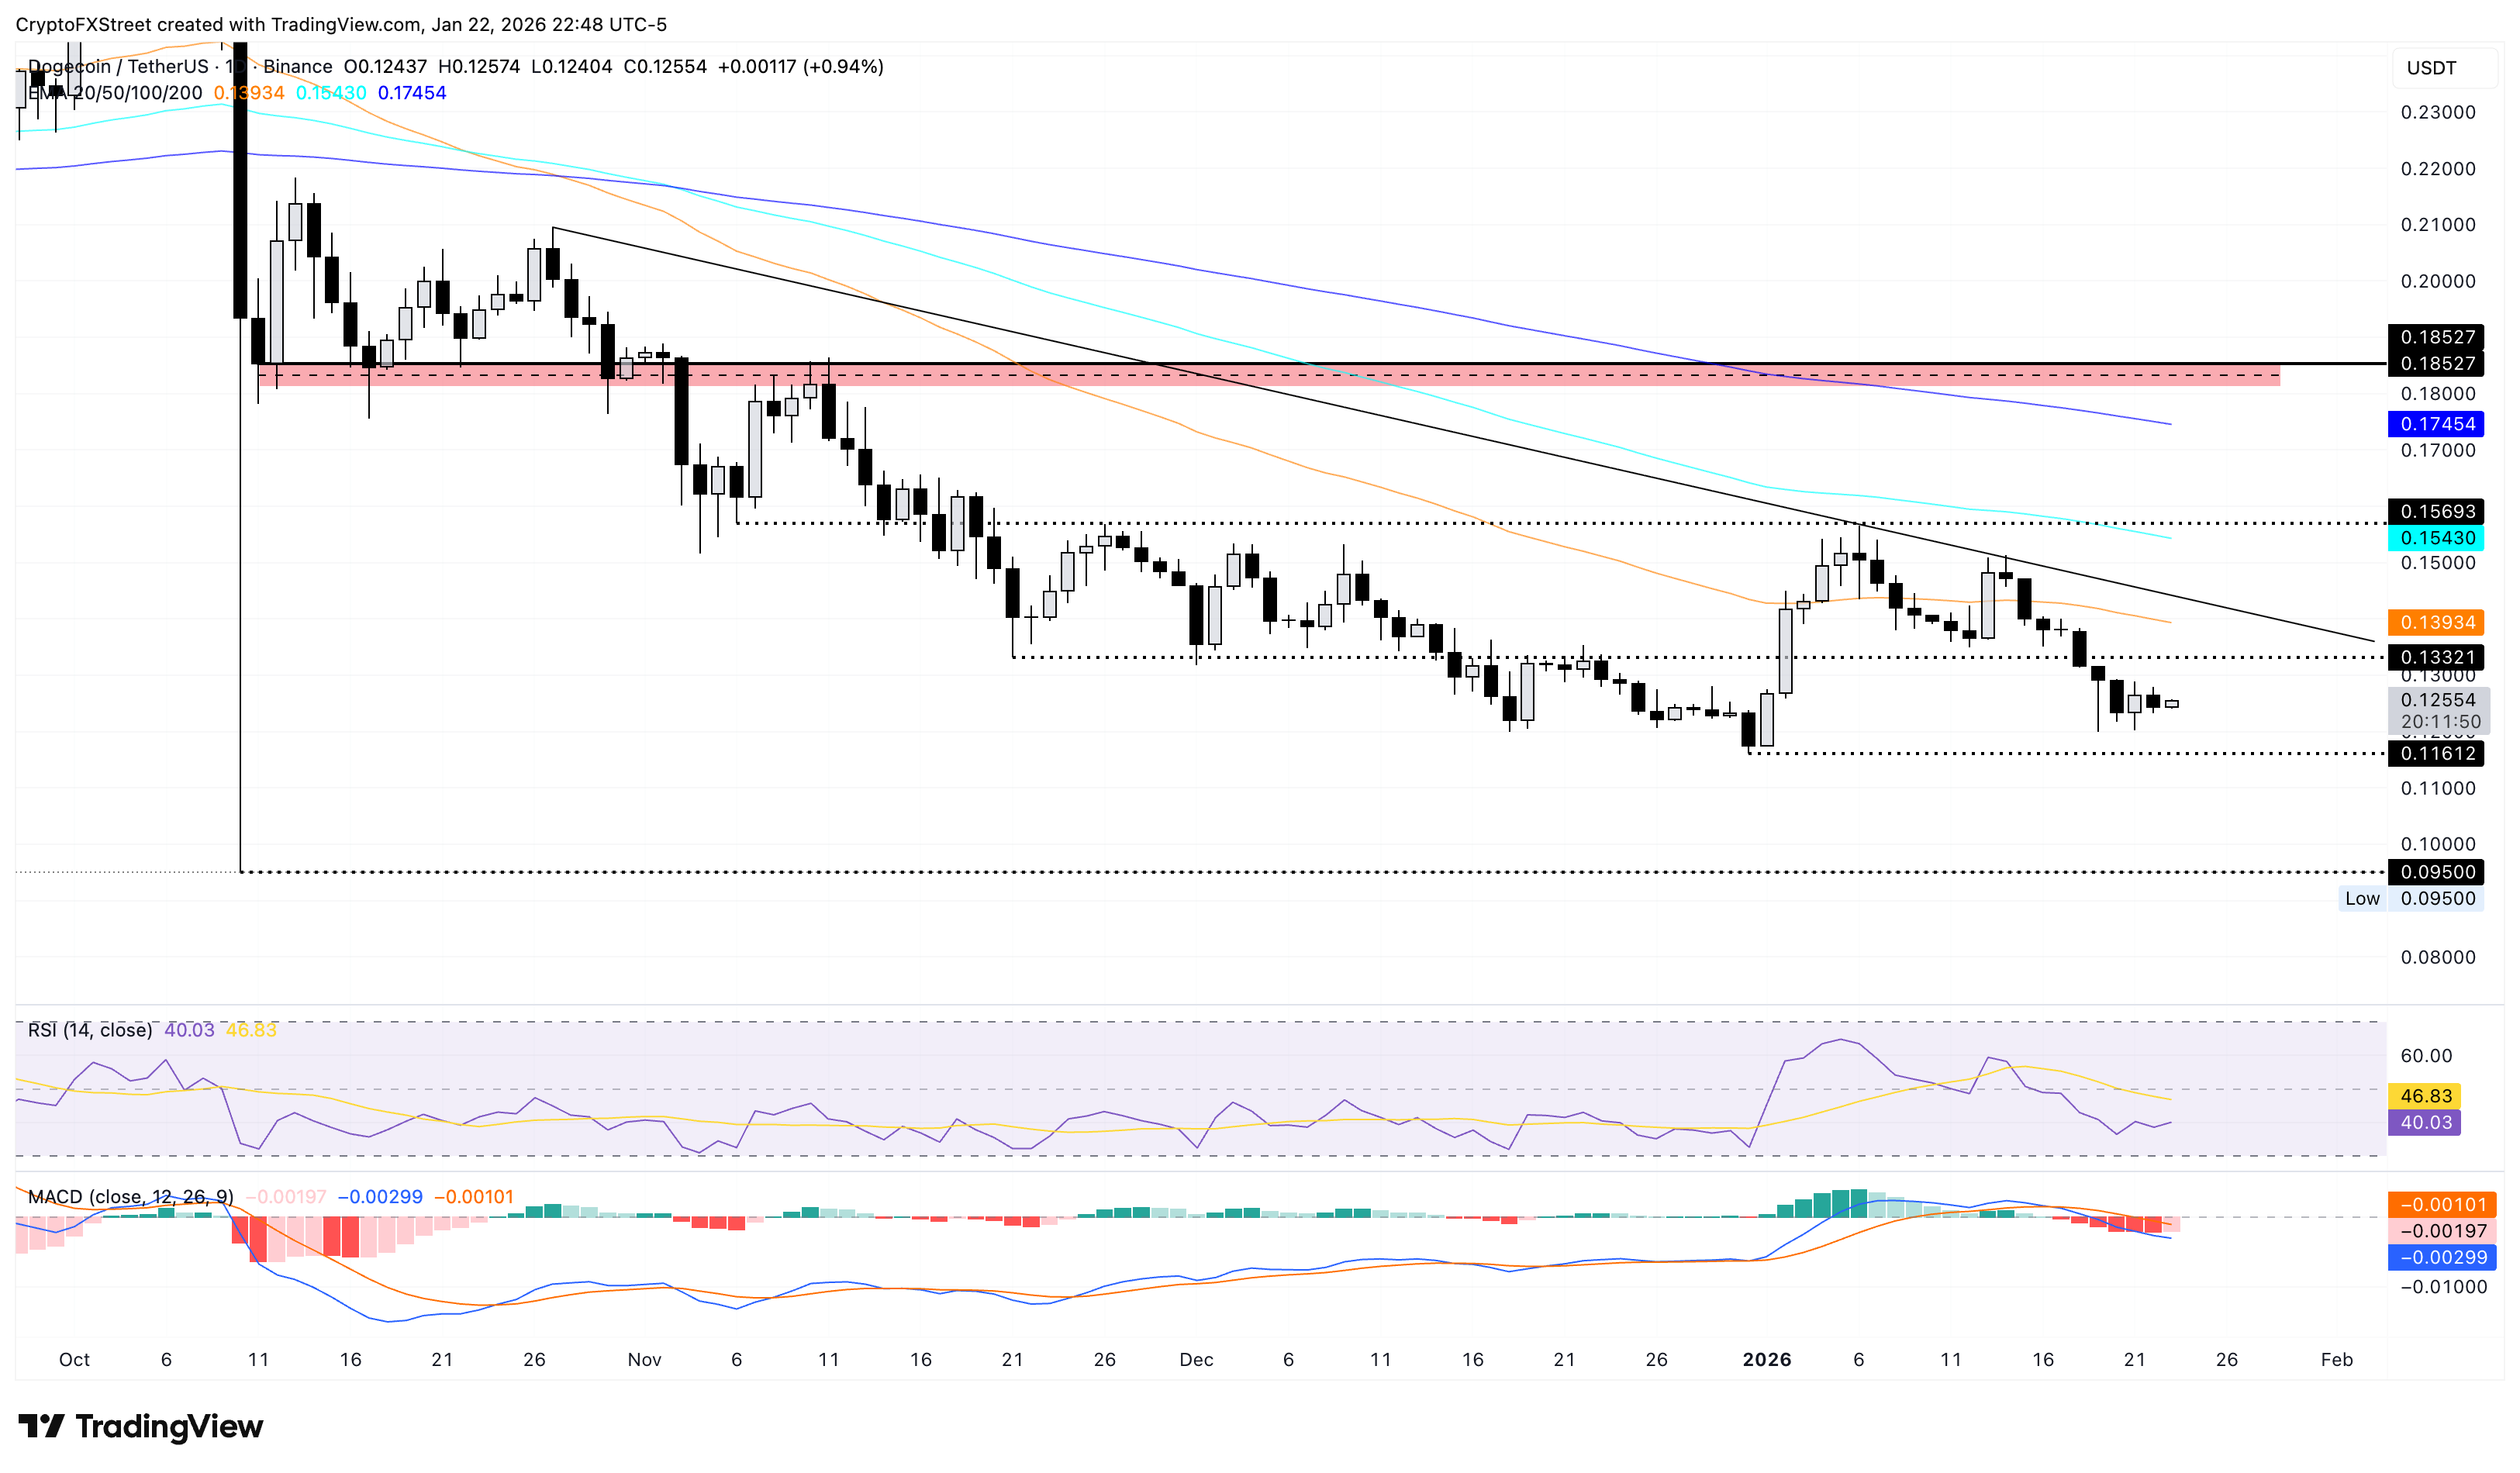
On the upside, a potential rebound could test the $0.1332 support-turned-resistance level marked by the November 21 low.
Shiba Inu’s short-term gains fuel consolidation
Shiba Inu recovers over 1% at the time of writing on Friday, consolidating below the 50-day EMA at $0.00000829. SHIB hovers above the $0.00000755 support marked by the November 21 low.
If SHIB drops below this level, it would threaten the $0.00000678 low from October 10, risking a fresh low.
The RSI is at 45 on the daily chart, below the halfway line, with further downside room, reflecting bearish potential. The MACD extends the decline below the zero line, signaling intense bearish momentum.
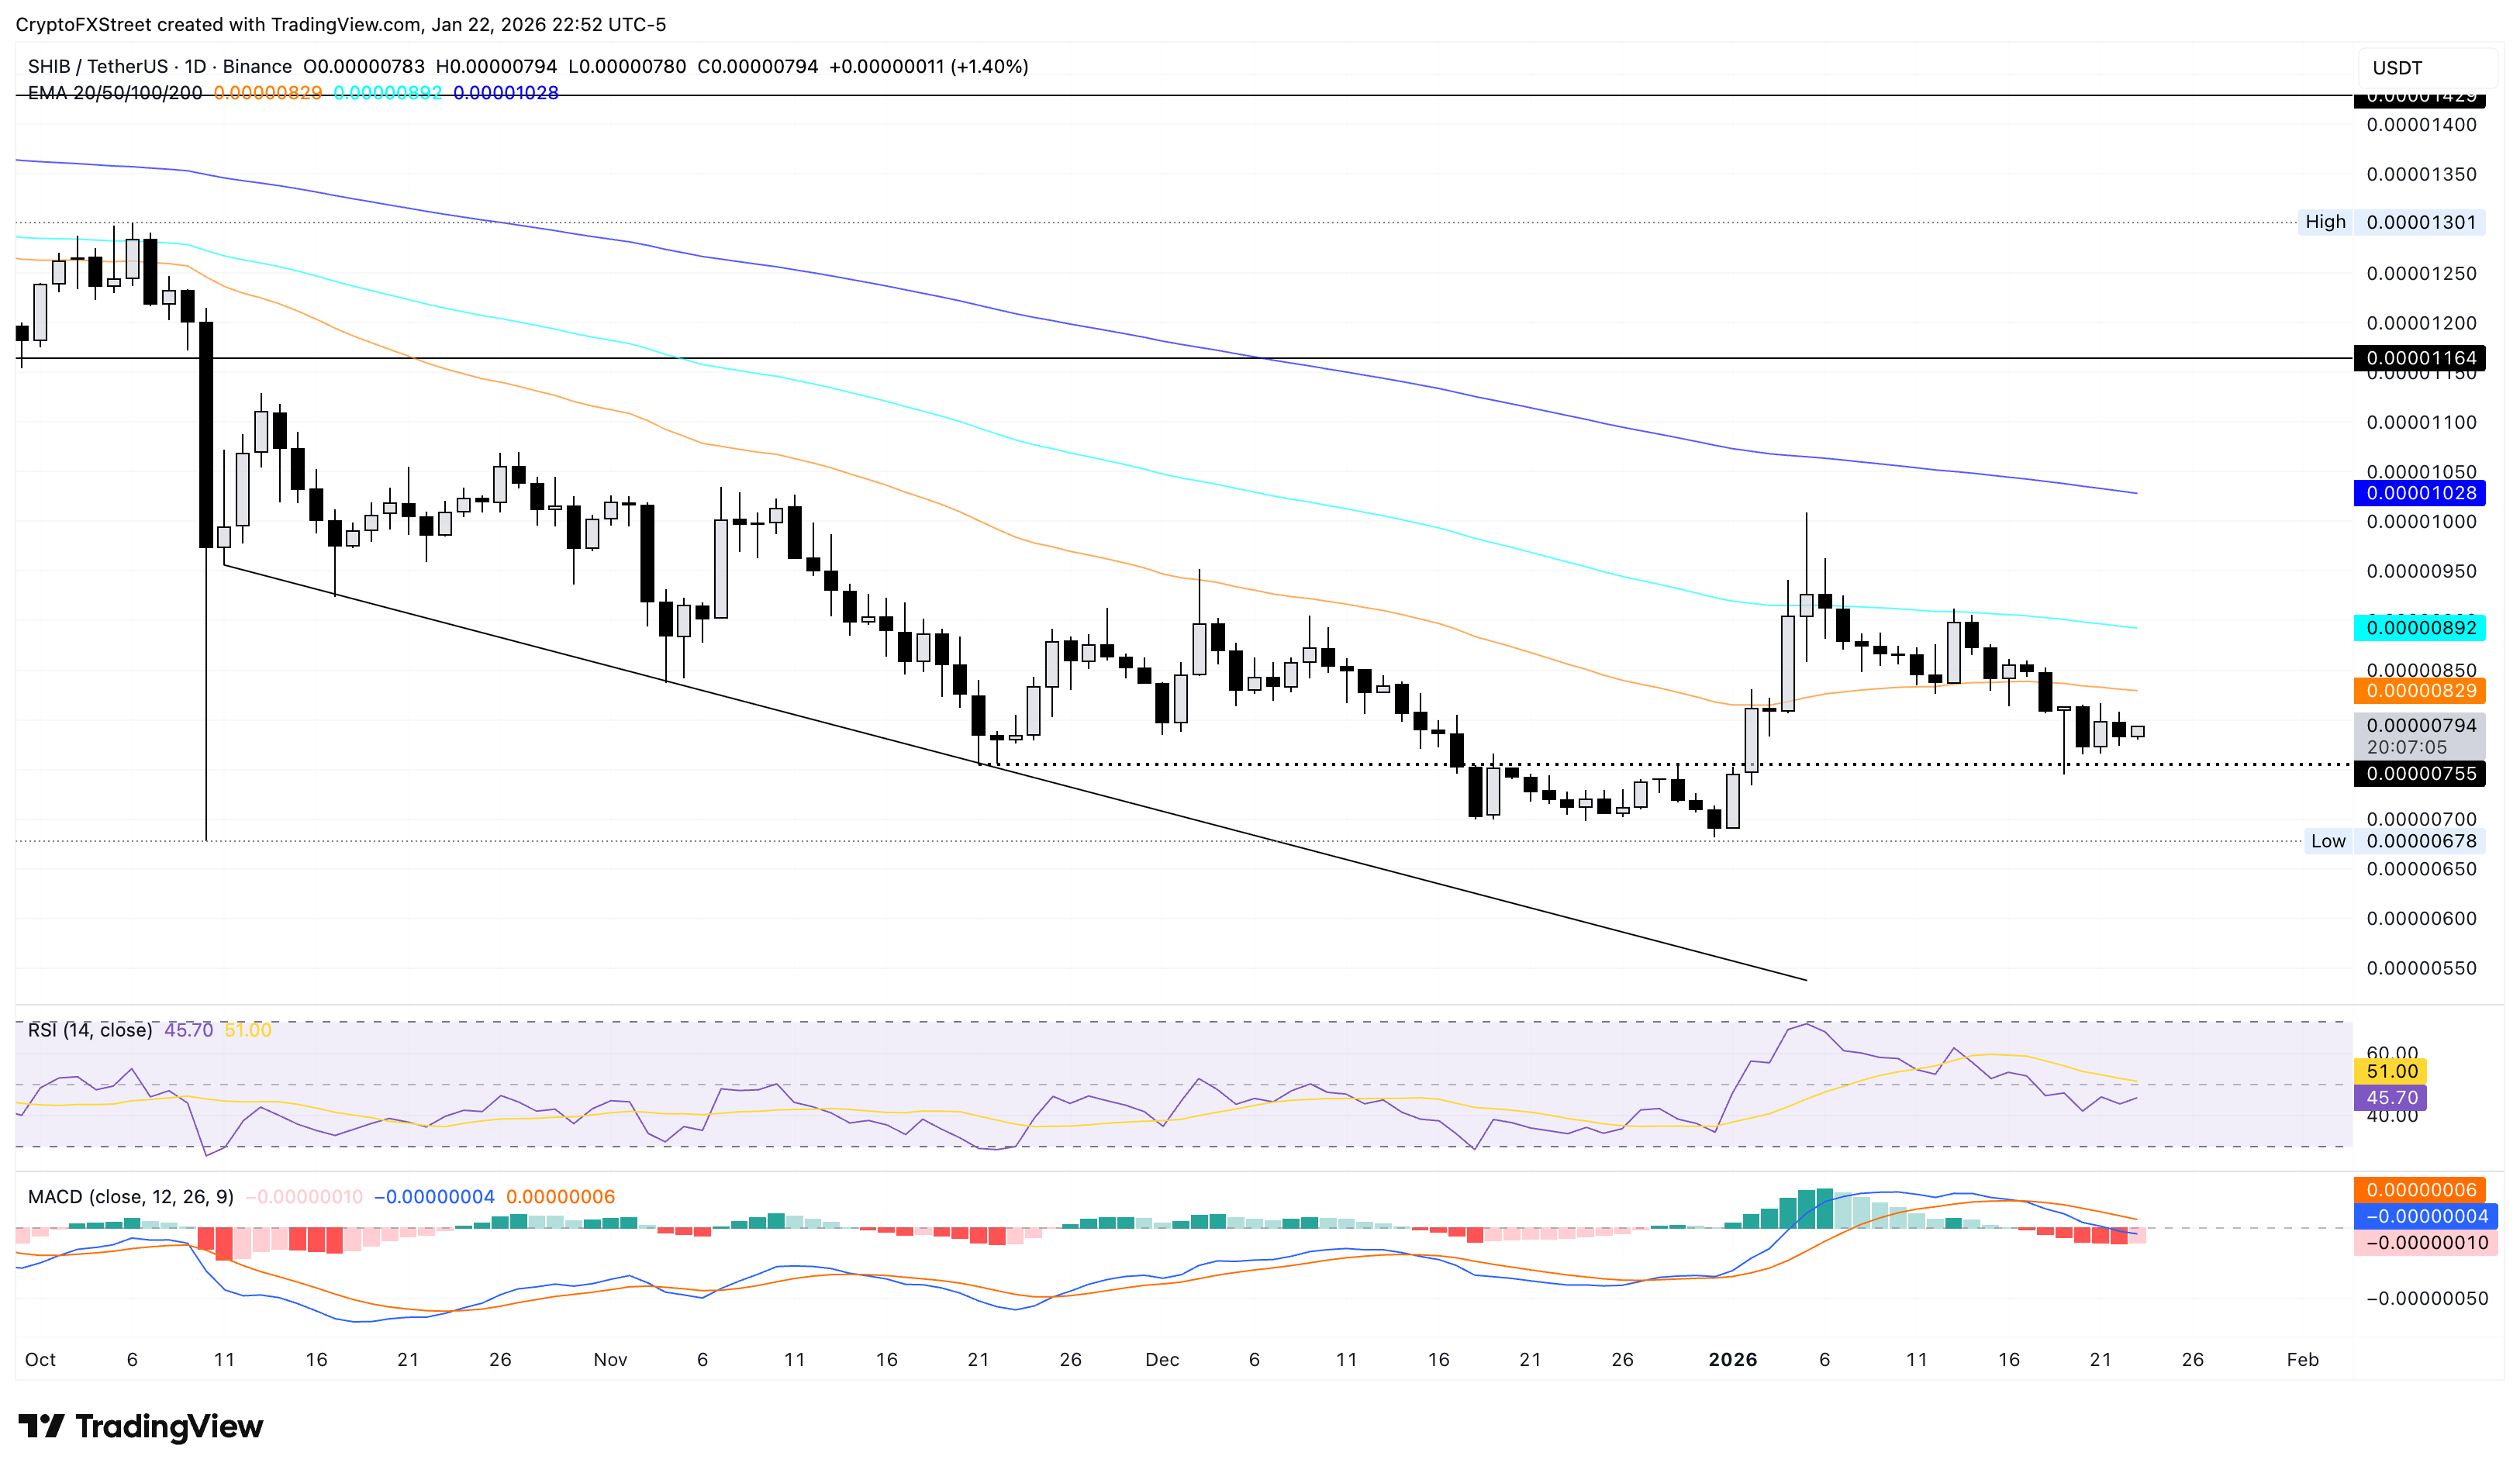
Looking up, the 50-day, 100-day, and 200-day EMAs at $0.00000829, $0.00000892, and $0.00001028, respectively, would likely cap short-term recoveries in SHIB.
Pepe is at a crucial psychological support, but risks further downside
Pepe extends its decline below the 50-day EMA at $0.00000535, with a nearly 8% loss so far this week. At the time of writing, PEPE lingers above the $0.00000500 psychological level on Friday, risking further decline after a 4% drop the previous day.
The crucial support at $0.00000363, which aligns with the December 18 low, signals a significant downside risk.
The RSI is at 41 on the daily chart and has crossed below the midline, while the MACD indicator shows a steady decline in both average lines, signaling a bearish bias in trend momentum.
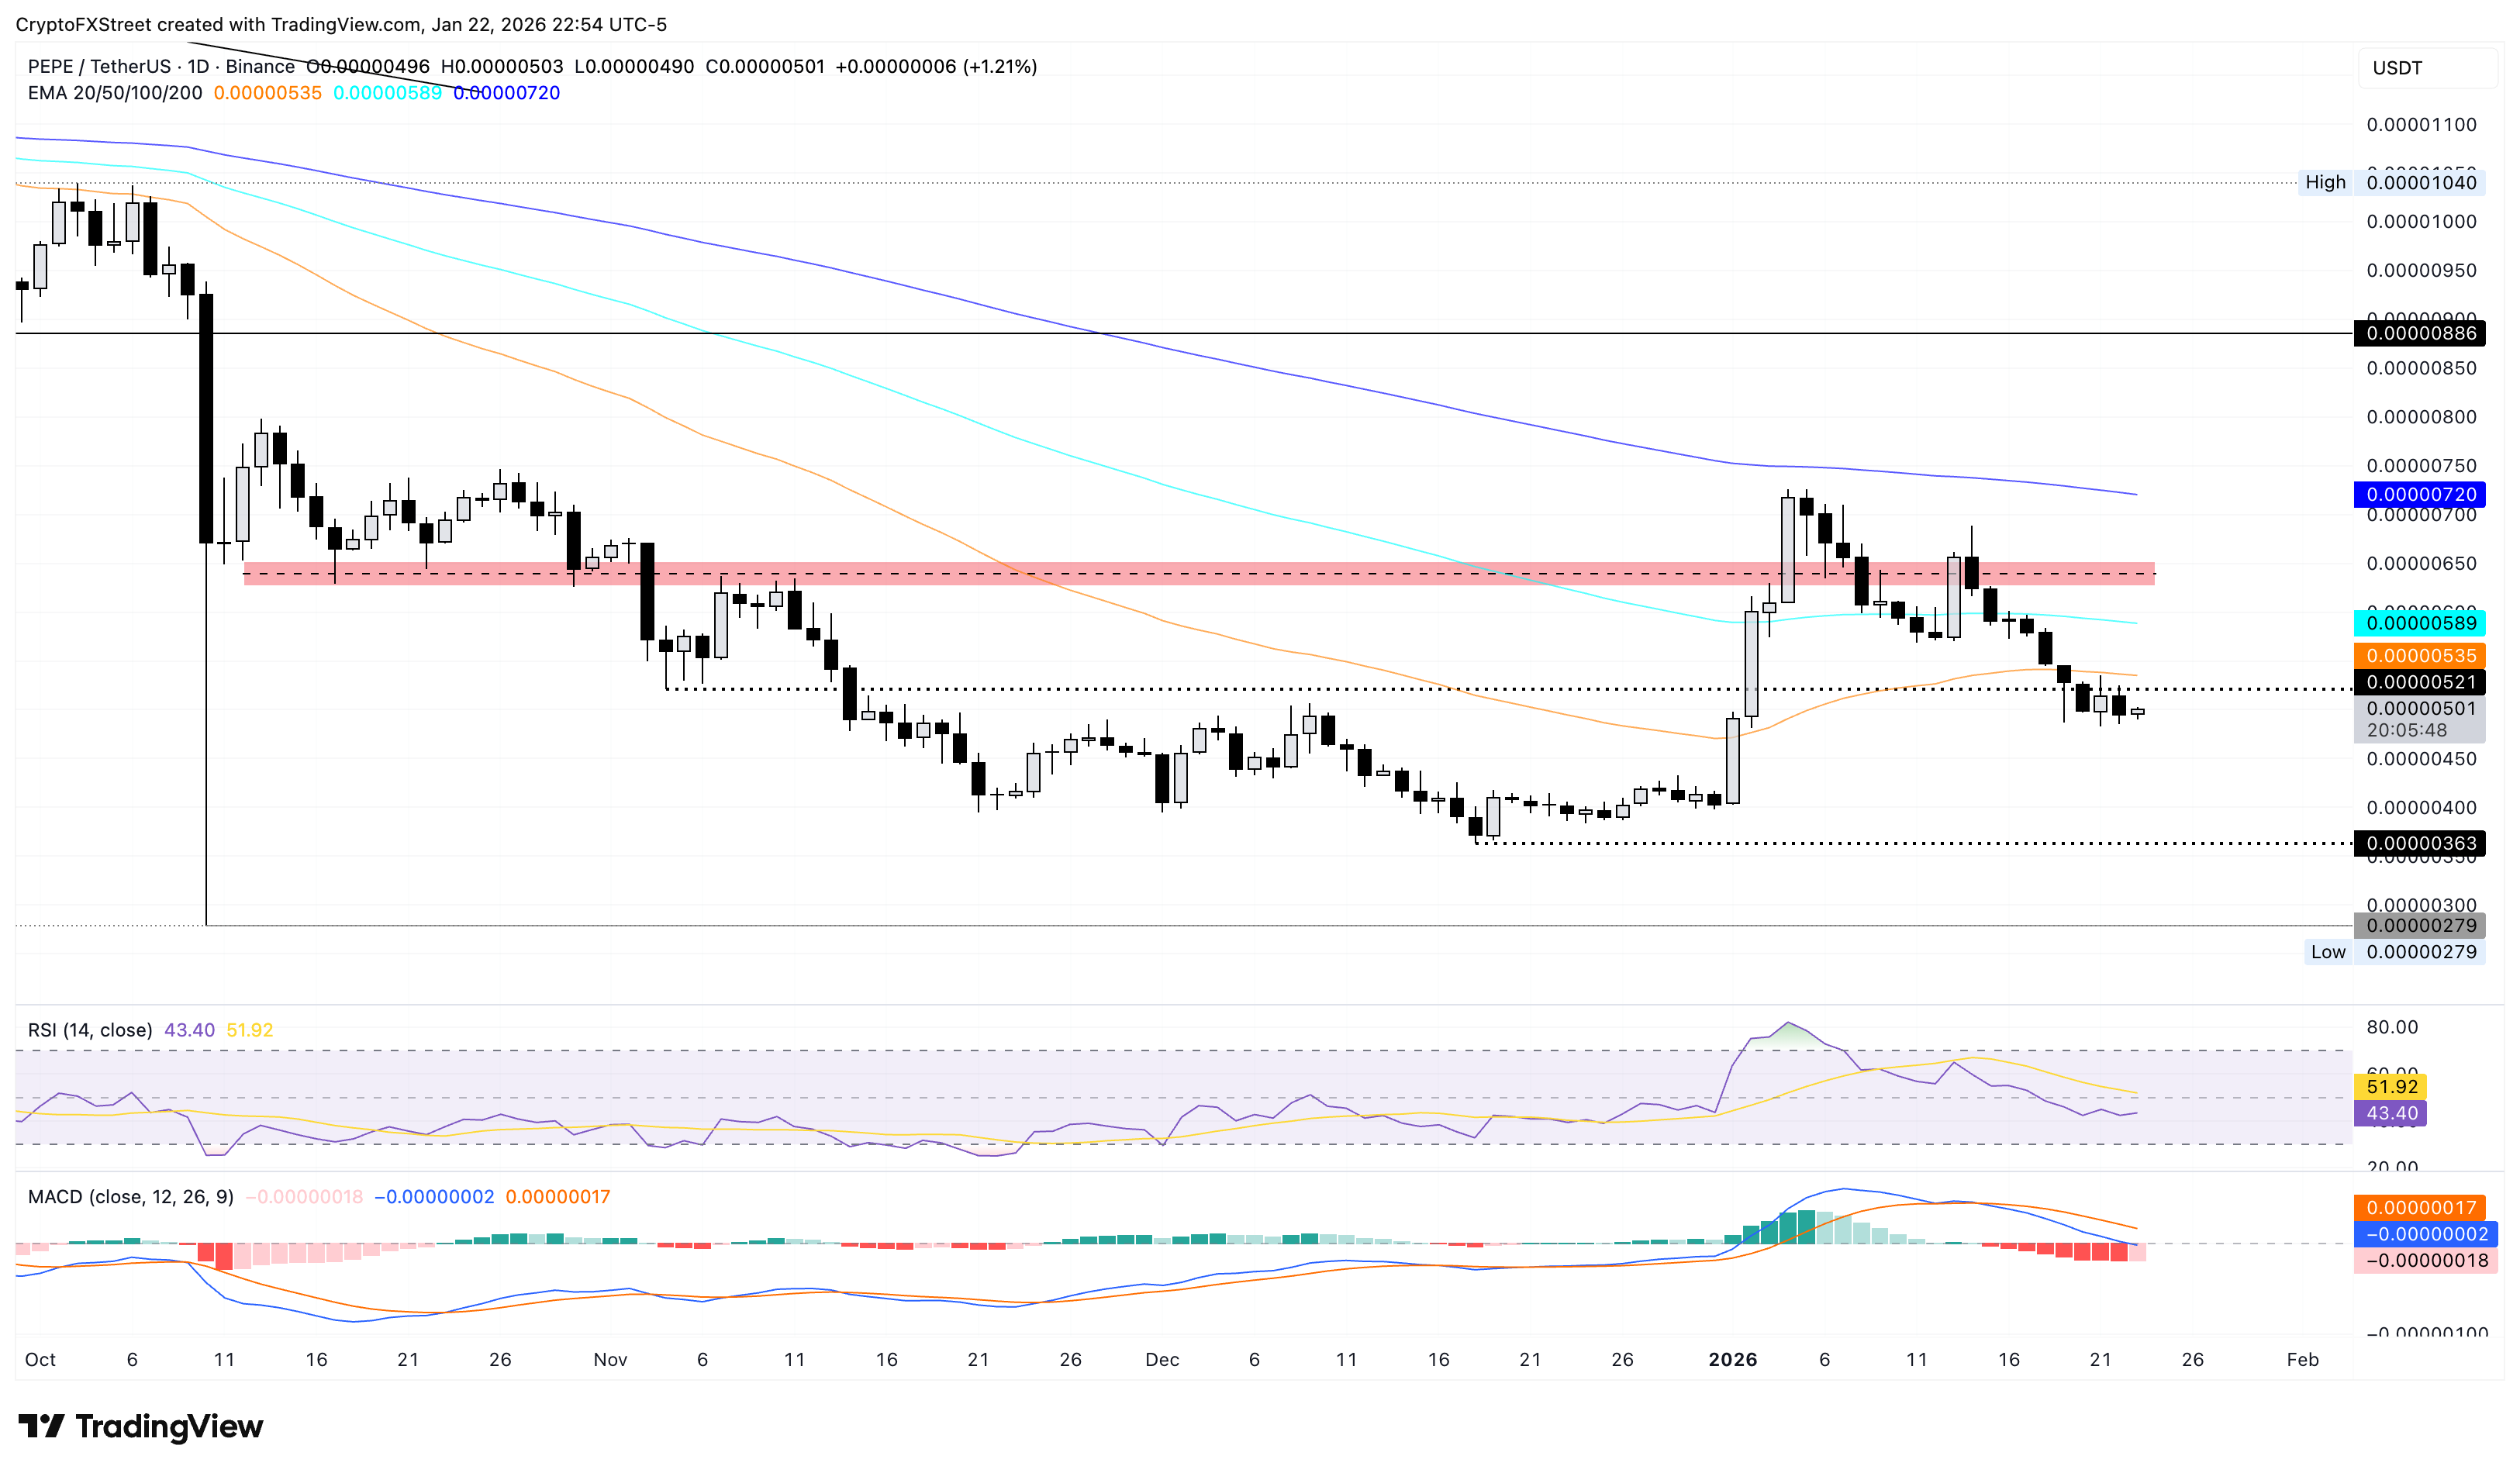
If PEPE rebounds from $0.00000500, it would face immediate resistance at the 50-day EMA at $0.00000535, followed by the 100-day EMA at $0.00000589.
Related Articles
Amazon Stock Predictions for 2026 to 2030: Will They Exceed Expectations and Achieve Major Long-Term Goals?
TradingKey - As we head into 2026, many investors are questioning where Amazon (AMZN) fits into the technology world.
A Crash After a Surge: Why Silver Lost 40% in a Week?
TradingKey - Spot silver (XAGUSD) prices continue to decline. Silver plunged 20% on Thursday, breaking below $71 per ounce, with the sell-off intensifying on Friday as prices fell further below $64. Compared to the all-time high set on January 29, silver prices have retraced more than 40%, wiping out nearly all gains accumulated over the previous month.
Google Cloud Revenue Surges 48% in Q4 as CapEx Guidance Nearly Doubles: Why the 7.5% After-Hours Dip?
TradingKey - After the close on February 4 (ET), Google (GOOG, GOOGL) released stellar Q4 results: total revenue grew 18% year-over-year, hitting a new quarterly record after revenue first surpassed $100 billion in Q3. The primary highlight was Google Cloud, where Q4 revenue surged 48% year-over-yea
Is Bitcoin’s Four-Year Cycle Dead in 2026?
Is the Bitcoin 4-year cycle dead? After 2025 broke historical records with a red post-halving year, institutional analysts explore if the Bitcoin price has decoupled from the halving countdown. Analyze the impact of spot ETFs, global liquidity, and the roadmap to the 2028 halving in this 2026 market

