

Top 3 Price Prediction: Bitcoin, Ethereum, Ripple – BTC, ETH and XRP extend correction as bearish pressure persists

- Bitcoin price hovers around $89,000 on Wednesday, after falling 9.2% over the past 7 days.
- Ethereum price closes below the daily support at $3,017, with bears targeting the $2,749 support.
- XRP momentum indicators suggest a strengthening bearish trend, signaling a risk of a deeper correction.
Bitcoin (BTC), Ethereum (ETH) and Ripple (XRP) steadied on Wednesday, after correcting by nearly 5%, 10% and 5%, respectively, so far this week. BTC slips below $90,000, while ETH and XRP close below their key daily supports. The momentum indicators of these top three cryptocurrencies by market capitalization suggest a strengthening bearish trend, hinting at a deeper correction.
Bitcoin bears are aiming for the $85,500 mark
Bitcoin price closed below the 61.8% Fibonacci retracement level (drawn from the April low of $74,508 to October’s all-time high of $126,199) at $94,253 on Sunday. BTC declined 5.79% over the next two days, closing below key support levels: the 50-day Exponential Moving Average (EMA) at $92,118 and the previously broken upper consolidation boundary at $90,000. As of Wednesday, BTC is rebounding slightly after retesting the midpoint of the horizontal parallel channel at $87,787.
If BTC continues its correction and closes below the immediate support at $87,787, it could extend the fall toward the lower consolidation boundary at $85,569, which coincides with the 78.60% Fibonacci retracement level.
The Relative Strength Index (RSI) on the daily chart reads 41, below the neutral level of 50, indicating bearish momentum gaining traction. The Moving Average Convergence Divergence (MACD) indicator also showed a bearish crossover on Tuesday, further supporting the downward view.
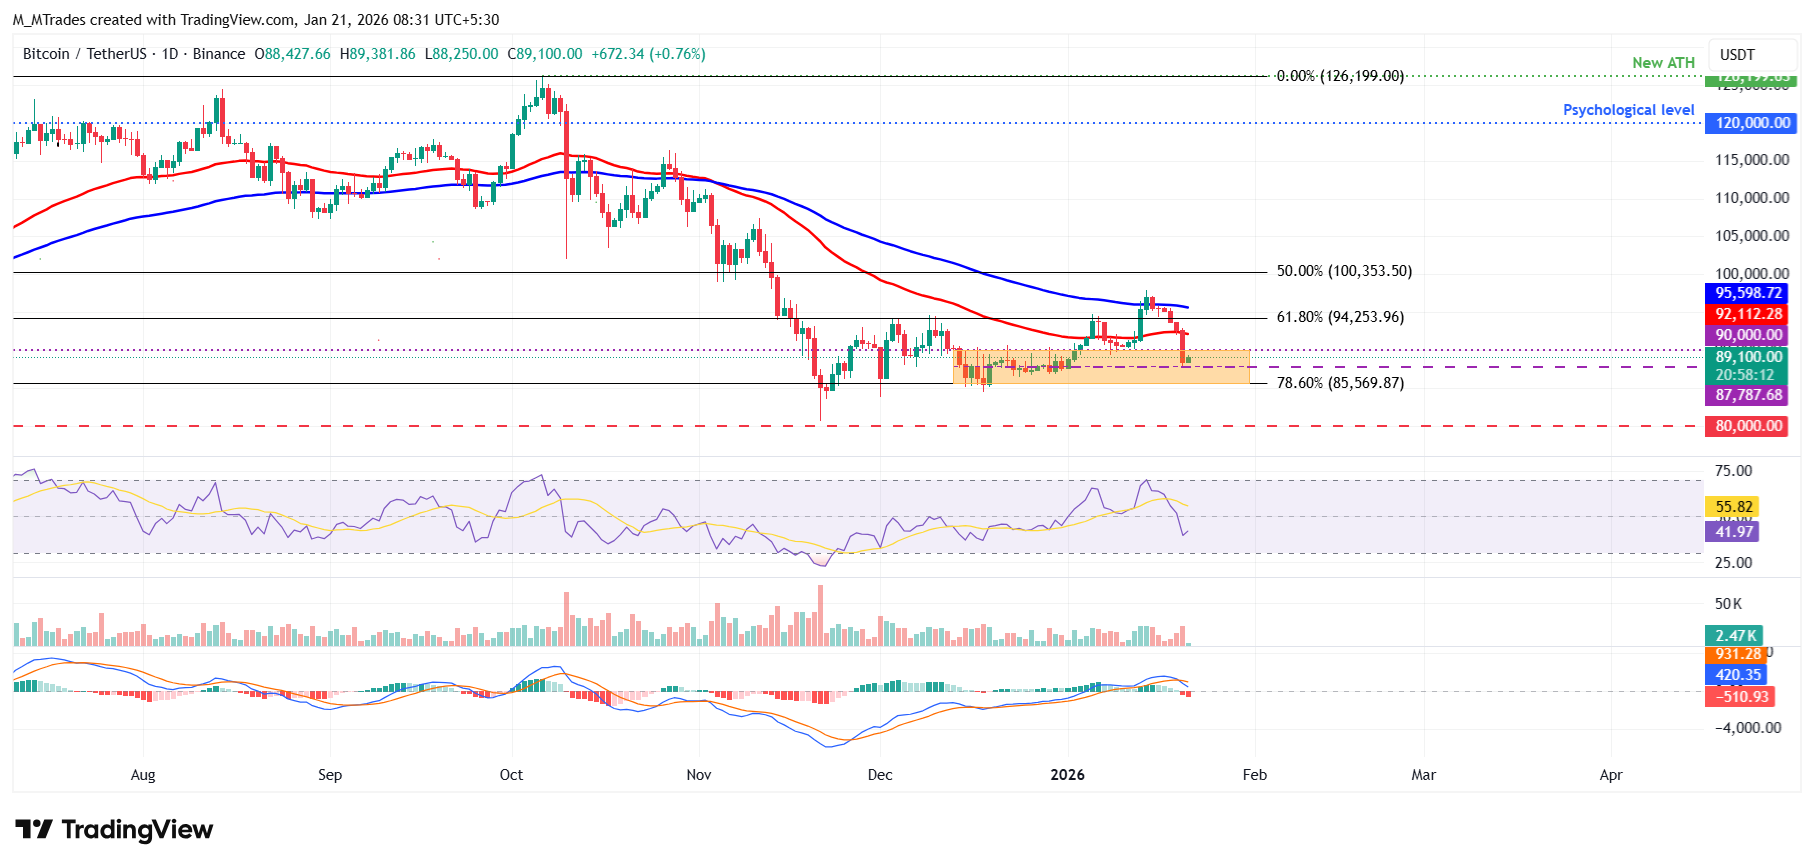
On the other side, if BTC recovers, it could extend the advance toward the 61.8% Fibonacci retracement level at $94,253.
Ethereum could extend its correction as it closes below key support
Ethereum price was rejected from the 200-day EMA at $3,334 last week and has declined by more than 10% as of this week, closing below the daily support at $3,017 on Tuesday. As of writing on Wednesday, ETH is trading at $2,966.
If ETH continues its correction, it could extend the decline toward the 61.8% Fibonacci retracement level (drawn from the April low of $1,385 to the August all-time high of $4,956) at $2,749.45.
Like Bitcoin, Ethereum’s RSI and MACD indicators show strengthening bearish momentum.
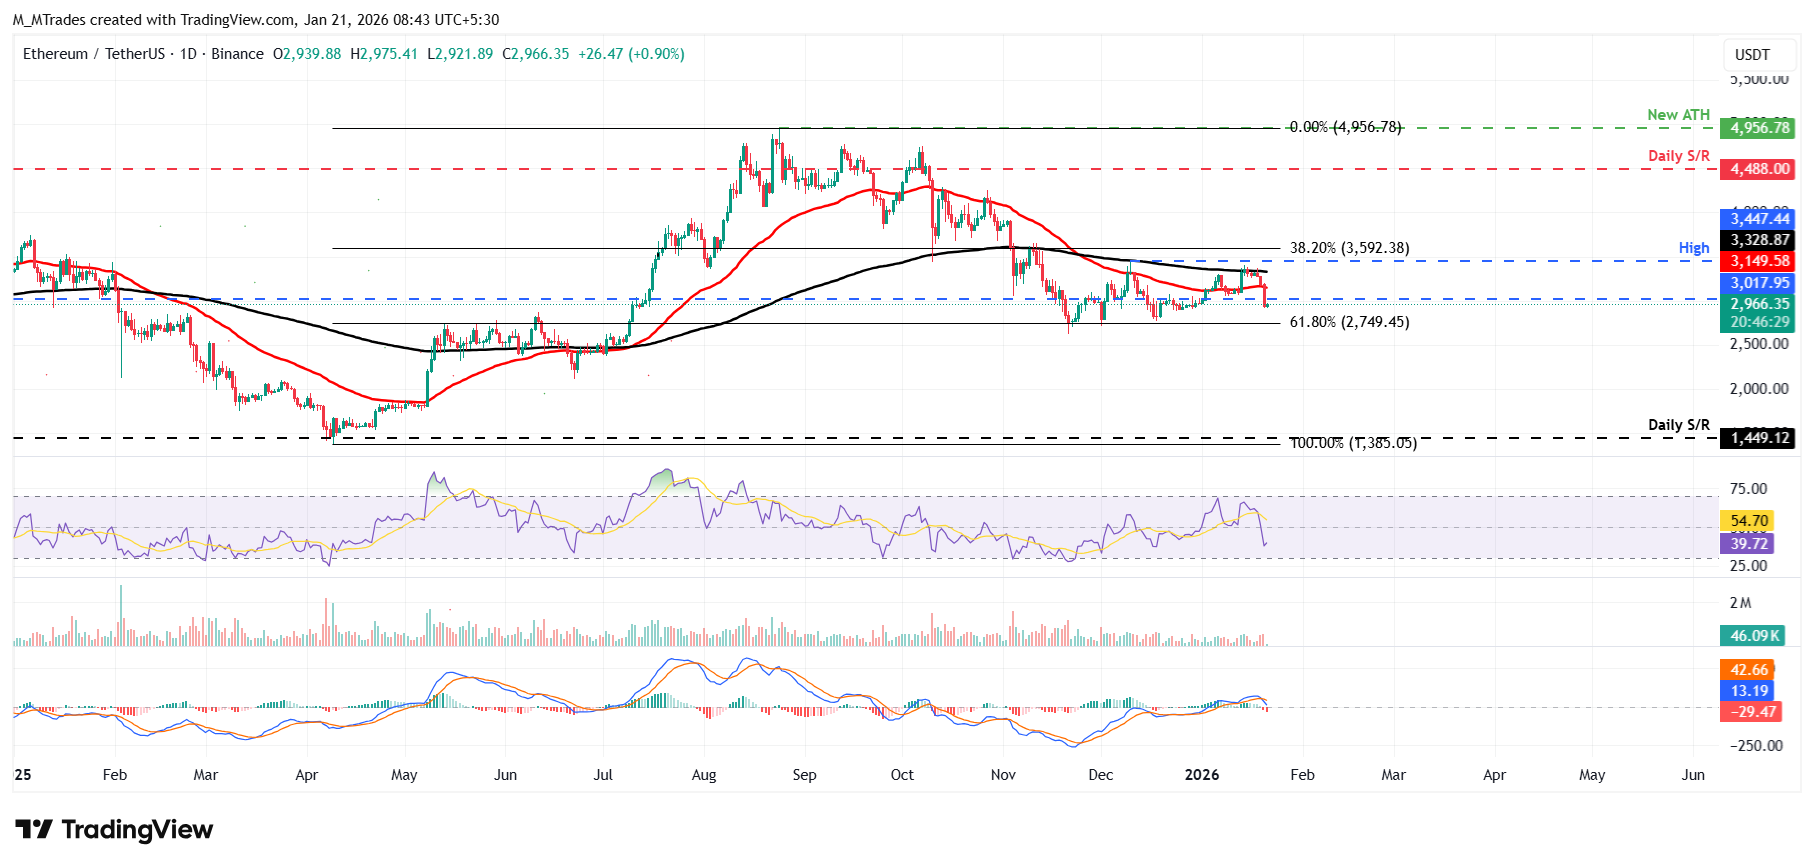
However, if ETH recovers, it could extend the advance toward the daily resistance level at $3,017.
XRP momentum indicators signal a deeper correction
XRP price faced rejection from the 50-day EMA at $2.05 on Friday and declined by more than 9%, closing below the daily support at $1.96 on Tuesday. At the time of writing on Wednesday, XRP is trading at $1.90.
If XRP continues its correction, it could extend the decline toward the December 19 low of $1.77.
Like Bitcoin and Ethereum, XRP's momentum indicators (RSI and MACD) also support a bearish view.
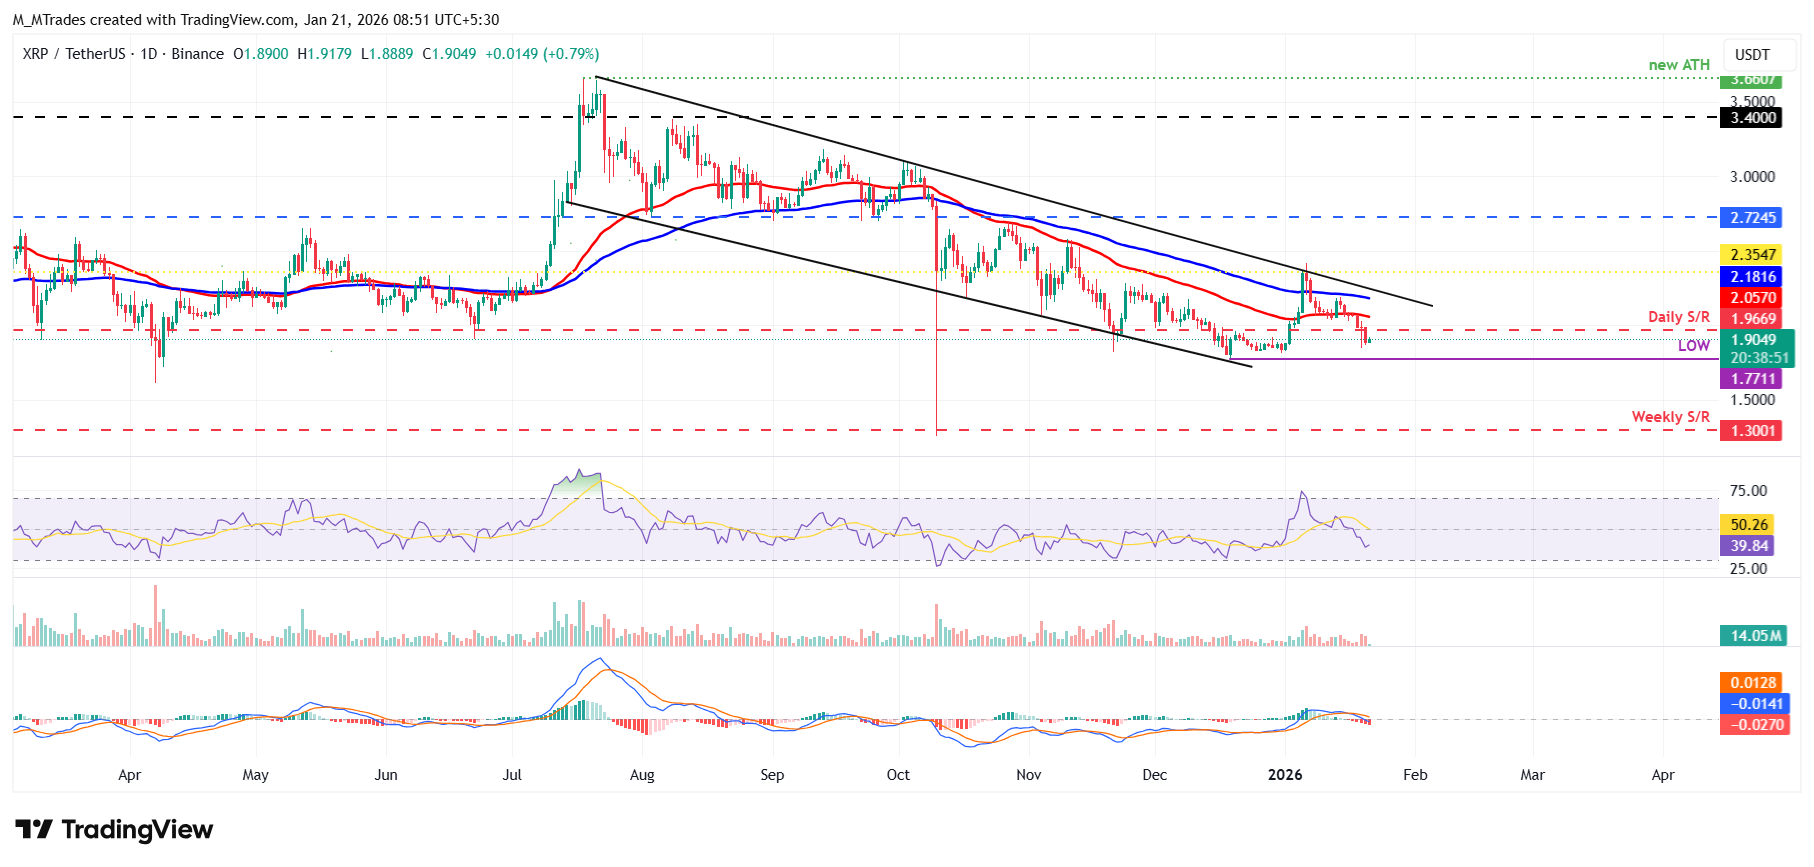
On the other hand, if XRP recovers, it could extend the advance toward the daily resistance level at $1.96.
Cryptocurrency metrics FAQs
The developer or creator of each cryptocurrency decides on the total number of tokens that can be minted or issued. Only a certain number of these assets can be minted by mining, staking or other mechanisms. This is defined by the algorithm of the underlying blockchain technology. On the other hand, circulating supply can also be decreased via actions such as burning tokens, or mistakenly sending assets to addresses of other incompatible blockchains.
Market capitalization is the result of multiplying the circulating supply of a certain asset by the asset’s current market value.
Trading volume refers to the total number of tokens for a specific asset that has been transacted or exchanged between buyers and sellers within set trading hours, for example, 24 hours. It is used to gauge market sentiment, this metric combines all volumes on centralized exchanges and decentralized exchanges. Increasing trading volume often denotes the demand for a certain asset as more people are buying and selling the cryptocurrency.
Funding rates are a concept designed to encourage traders to take positions and ensure perpetual contract prices match spot markets. It defines a mechanism by exchanges to ensure that future prices and index prices periodic payments regularly converge. When the funding rate is positive, the price of the perpetual contract is higher than the mark price. This means traders who are bullish and have opened long positions pay traders who are in short positions. On the other hand, a negative funding rate means perpetual prices are below the mark price, and hence traders with short positions pay traders who have opened long positions.
Related Articles
Amazon Stock Predictions for 2026 to 2030: Will They Exceed Expectations and Achieve Major Long-Term Goals?
TradingKey - As we head into 2026, many investors are questioning where Amazon (AMZN) fits into the technology world.
A Crash After a Surge: Why Silver Lost 40% in a Week?
TradingKey - Spot silver (XAGUSD) prices continue to decline. Silver plunged 20% on Thursday, breaking below $71 per ounce, with the sell-off intensifying on Friday as prices fell further below $64. Compared to the all-time high set on January 29, silver prices have retraced more than 40%, wiping out nearly all gains accumulated over the previous month.
Google Cloud Revenue Surges 48% in Q4 as CapEx Guidance Nearly Doubles: Why the 7.5% After-Hours Dip?
TradingKey - After the close on February 4 (ET), Google (GOOG, GOOGL) released stellar Q4 results: total revenue grew 18% year-over-year, hitting a new quarterly record after revenue first surpassed $100 billion in Q3. The primary highlight was Google Cloud, where Q4 revenue surged 48% year-over-yea
Is Bitcoin’s Four-Year Cycle Dead in 2026?
Is the Bitcoin 4-year cycle dead? After 2025 broke historical records with a red post-halving year, institutional analysts explore if the Bitcoin price has decoupled from the halving countdown. Analyze the impact of spot ETFs, global liquidity, and the roadmap to the 2028 halving in this 2026 market

