

Crypto Today: Bitcoin, Ethereum hold steady, XRP slides after DoJ criminal investigation into Fed Chair Powell

- Bitcoin holds above $90,000 after briefly trading beyond $92,000 amid a DoJ criminal investigation into Fed Chair Jerome Powell.
- Ethereum remains range-bound between $3,000 support and $3,300 resistance, weighed down by declining retail demand.
- XRP extends its decline below the 50-day EMA, mirroring a weakening derivatives market.
Bitcoin (BTC) is trading above $90,000 at the time of writing on Monday, after rising to an intraday high of $92,519. The brief upswing was driven by crypto investors downplaying the United States (US) Department of Justice’s (DoJ) criminal investigation into Jerome Powell, the Chair of the Federal Reserve (Fed).
Altcoins, including Ethereum (ETH) and Ripple (XRP), followed in Bitcoin’s footsteps, briefly rising before trimming the same gains amid profit-taking and escalating volatility.
US DoJ opens criminal investigation into Fed Chair Powell
Fed Chair Jerome Powell is under criminal investigation by the federal prosecutors following months of speculation and escalation. According to the Wall Street Journal (WSJ), Powell confirmed the investigation in a statement issued on Sunday.
The procedure concerns Powell’s testimony regarding the renovation of the Fed headquarters. However, in a video message released by the central bank, the Fed chair argued that the investigation reflects the US President Donald Trump’s administration’s hostile push for lower interest rates.
Powell stated that “This is about whether the Fed will be able to continue to set interest rates based on evidence and economic conditions – or whether instead monetary policy will be directed by political pressure or intimidation.”
Trump has denied any involvement in this situation during an interview with NBC News, adding that Powell is “certainly not very good at the Fed, and he’s not very good at building buildings.”
The crypto market remains on edge even as traders brace for potential volatility. Bitcoin is holding above $90,000, while Ethereum is trading in a $3,000-$3,300 range. Meanwhile, XRP is down over 1% and trading at $2.05 at the time of writing.
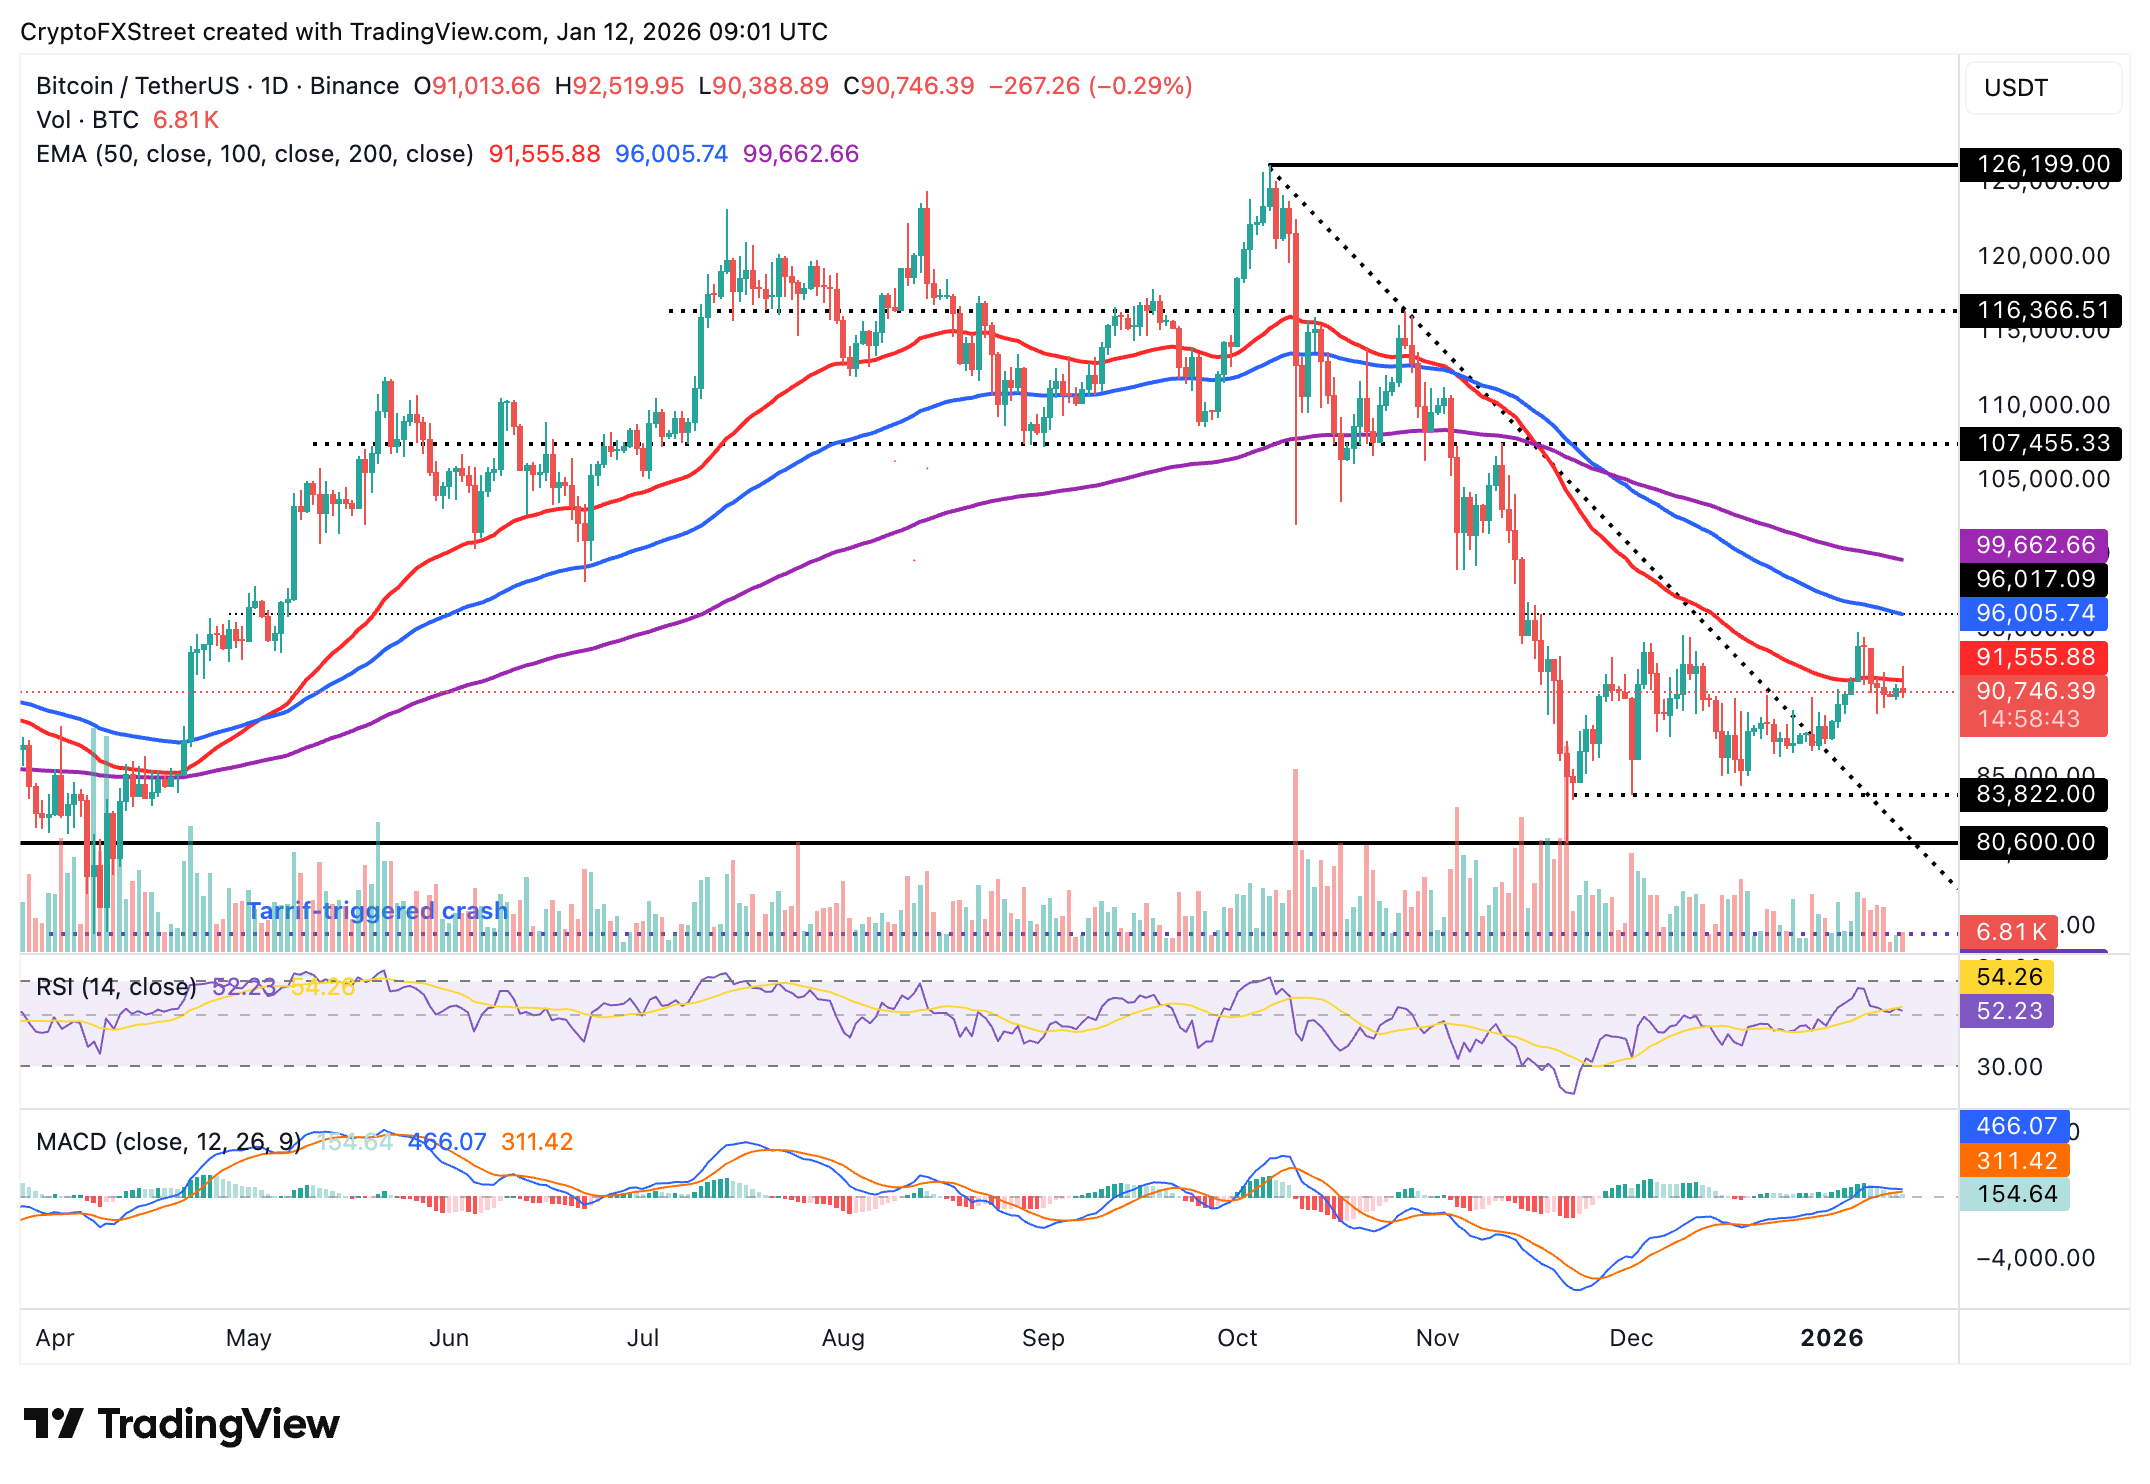
Chart of the day: Bitcoin trades under pressure as support holds
Bitcoin is trading above $90,000 at the time of writing on Monday, while the 50-day Exponential Moving Average (EMA) caps the upside at $91,555. The Relative Strength Index (RSI) shows a slight negative divergence at 52 on the daily chart, suggesting that bullish momentum may deteriorate further if the RSI slides below the 50 midline.
Hence, a correction below $90,000 remains on the cards, with downside targets at $89,311 (last tested on Thursday) and $83,822 (tested on December 1).
Still, the Moving Average Convergence Divergence (MACD) indicator on the same chart has maintained a buy signal since December 21, which could continue to support a short-term bullish outlook. Investors will likely lean more into risk if the green histogram bars above the mean line expand, which would confirm BTC’s bullish thesis.
A close above the 100-day EMA at $96,005 could open the door for an extended recovery toward the 200-day EMA at $99,662, with a break above $100,000 potentially marking the beginning of the next major leg up.
Altcoins technical update: Ethereum, XRP face declining retail demand
Ethereum is trading above $3,100 at the time of writing on Monday, held down by the 50-day EMA at $3,125, the 100-day EMA at $3,287 and the 200-day EMA at $3,339. The RSI is at 53 on the daily chart, indicating a slight negative divergence. If the RSI slides below the midline, the path of least resistance could remain downward, increasing the odds of ETH testing the lower-range support at $3,000.
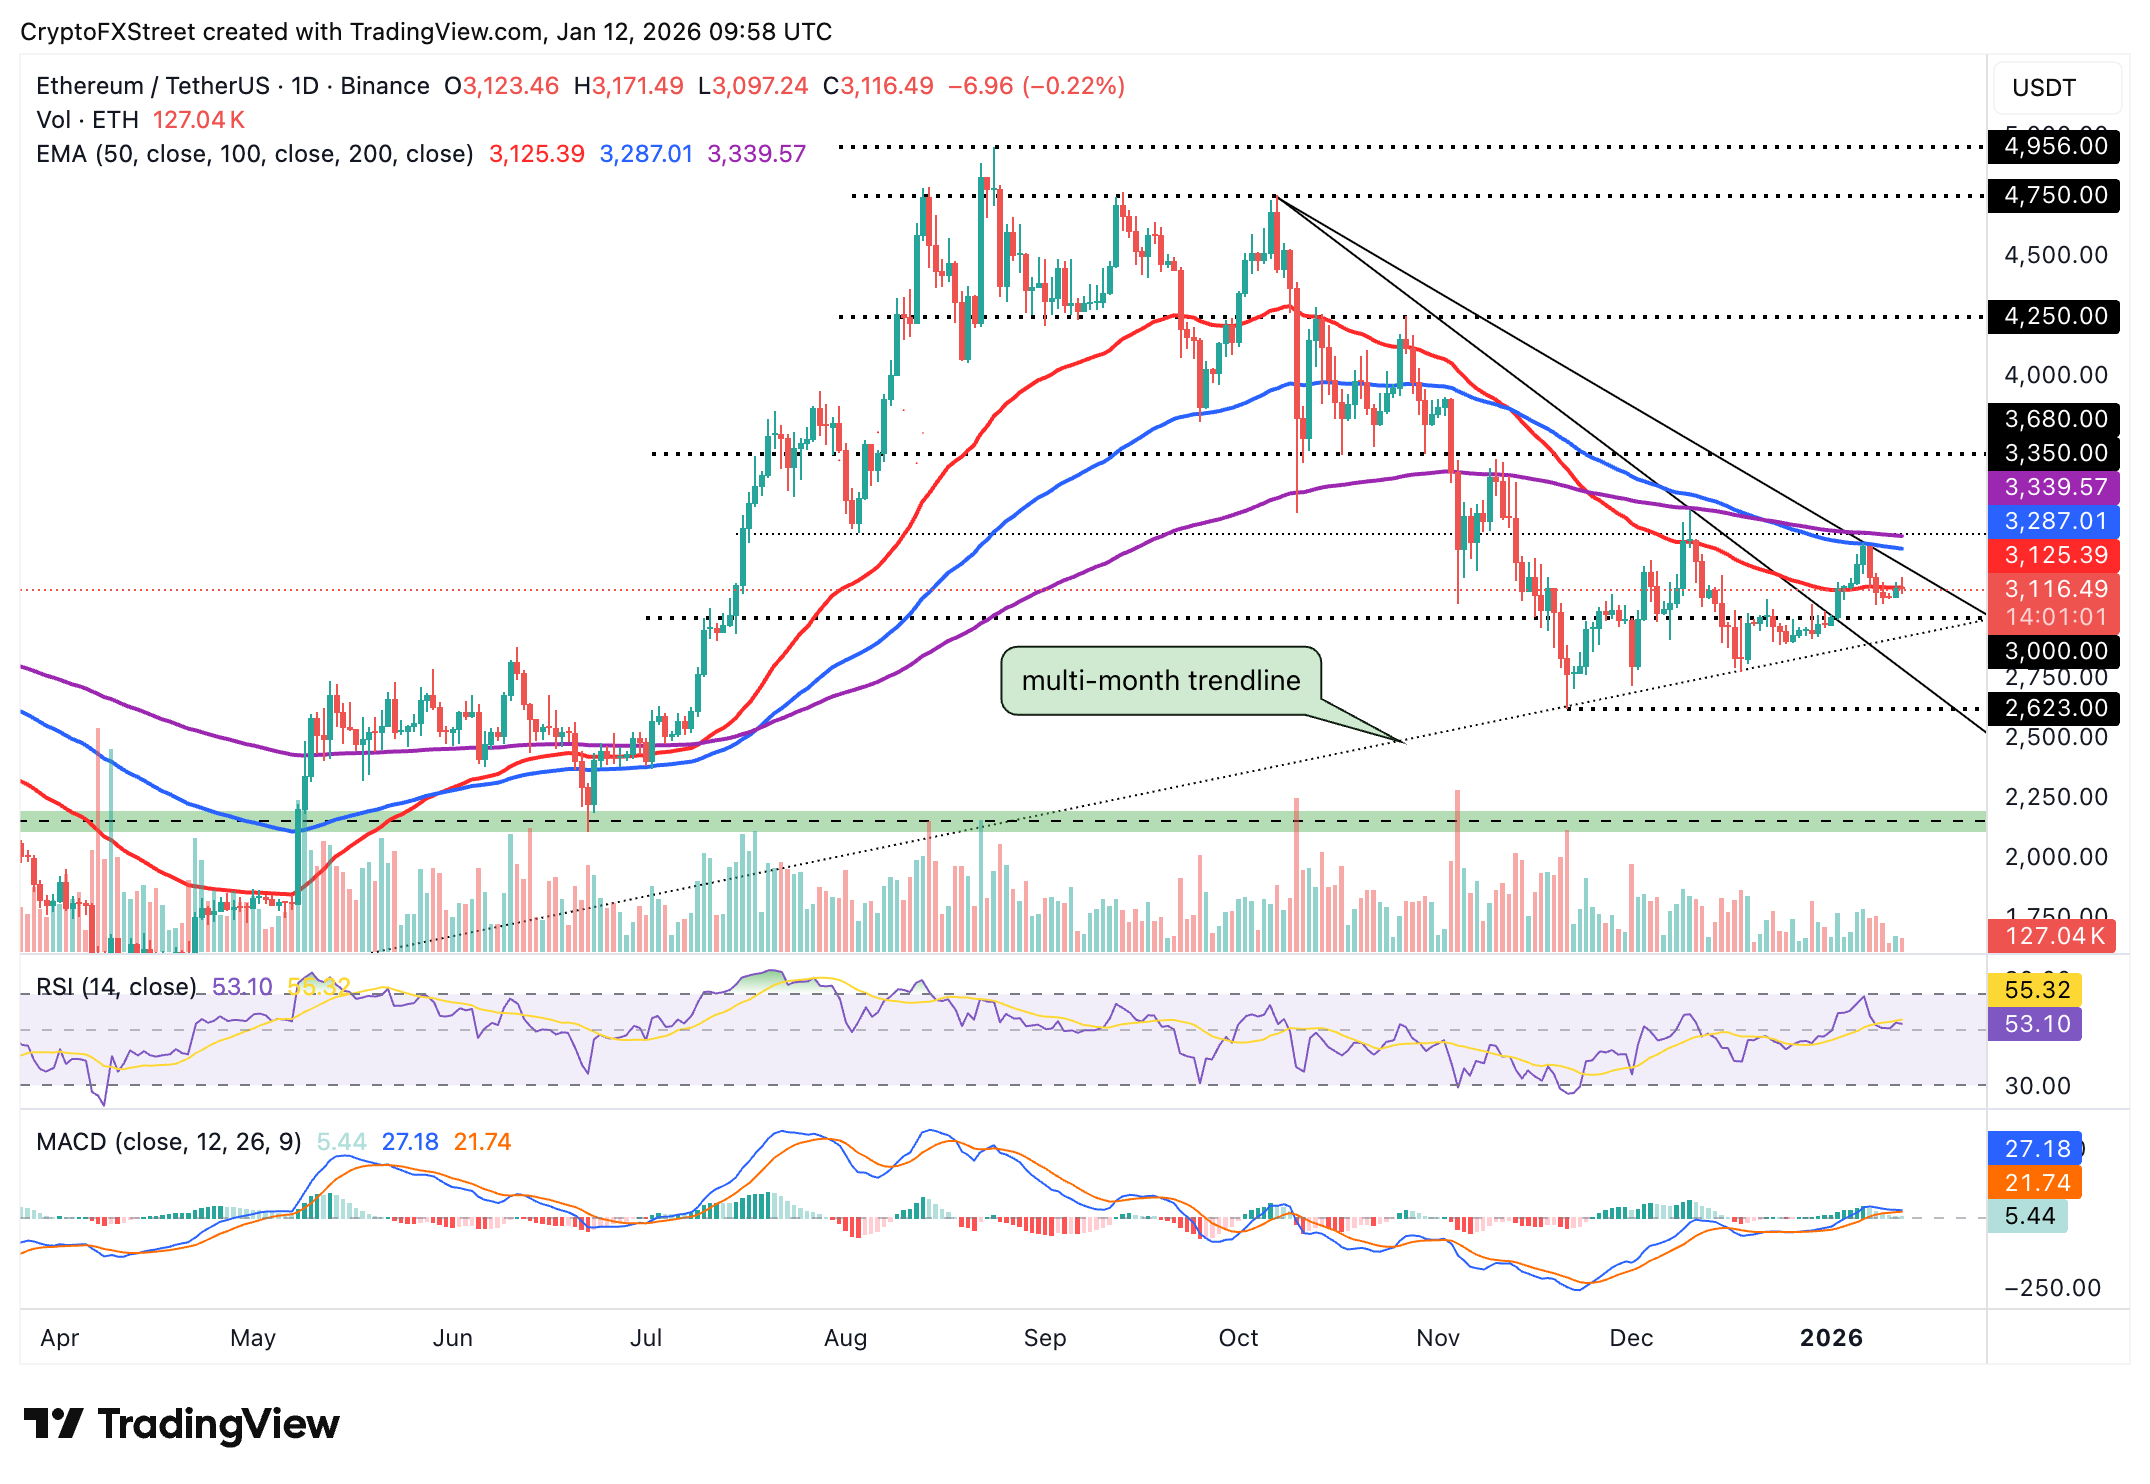
A daily close above the 50-day EMA would confirm a slight bullish edge. Traders should watch for a clear buy signal from the MACD indicator on the daily chart before going all in on ETH.
The upper-range resistance at $3,300 caps the upside, with a push above the 200-day EMA required to open the door to a breakout above $3,500.
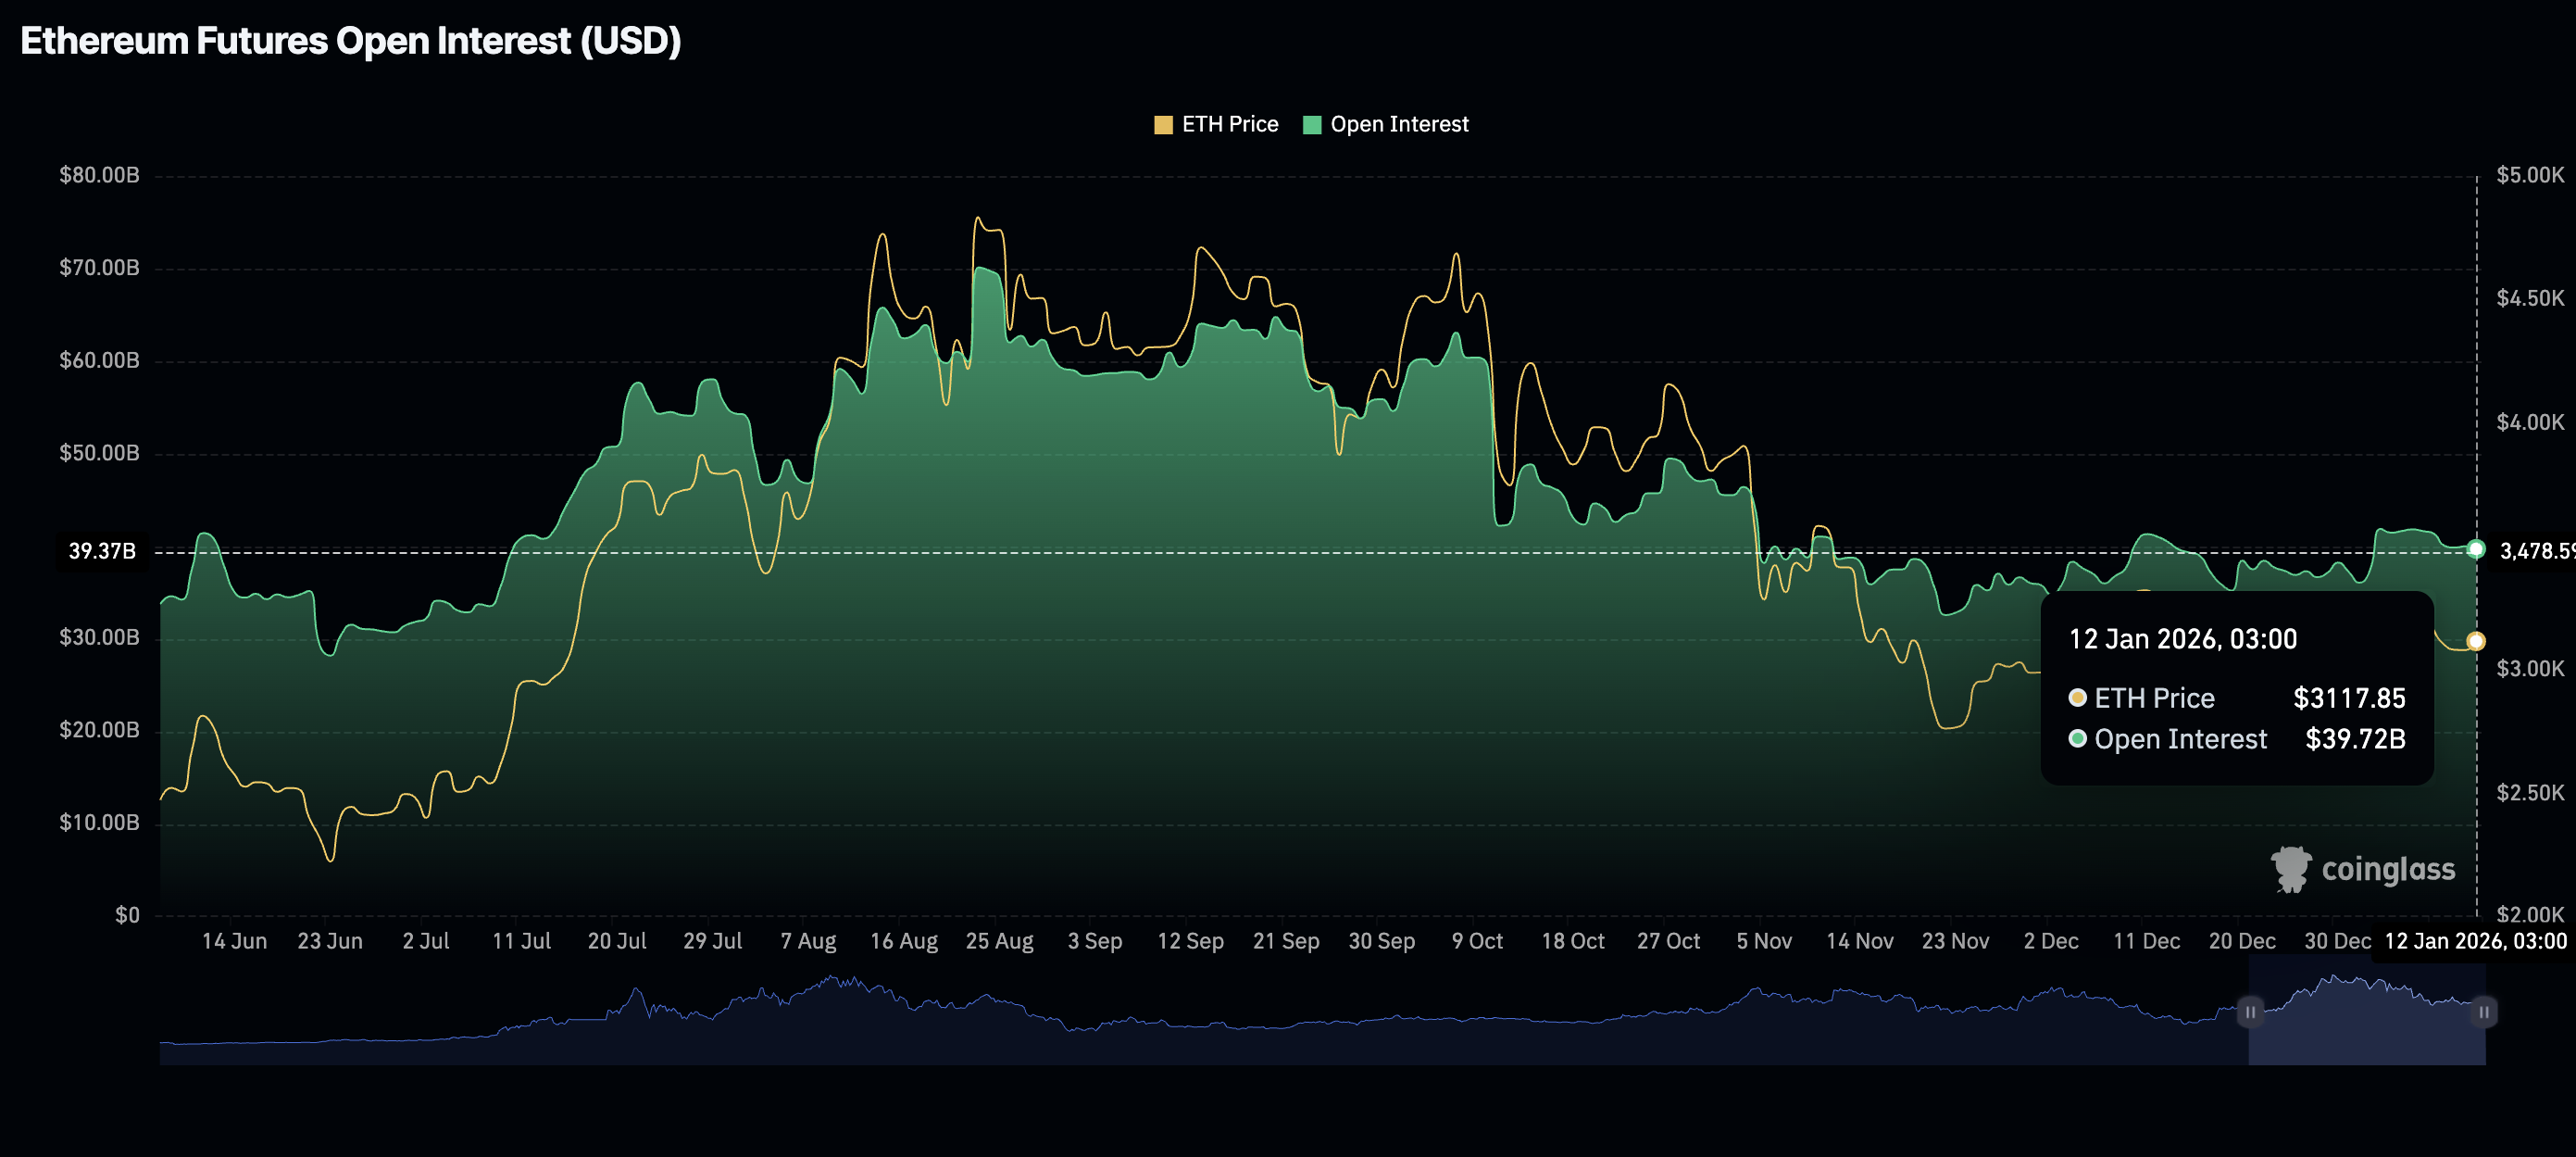
However, CoinGlass data shows that retail demand is narrowing, as evidenced by futures Open Interest (OI) falling to $39.72 billion on Monday, from $40 billion on Sunday. Demand for ETH derivatives has been declining gradually since the start of the year, when OI averaged $41.89 billion on January 3.
Similarly, XRP also faces a liquidity crunch in the derivatives market, as OI has dropped to approximately $4 billion on Monday from $4.51 billion on Wednesday. The slump in OI suggests that investors are losing confidence in the token’s ability to sustain an uptrend. As traders reduce their risk exposure, demand for XRP derivatives narrows, leaving prices vulnerable to existing supply and profit-taking initiatives.
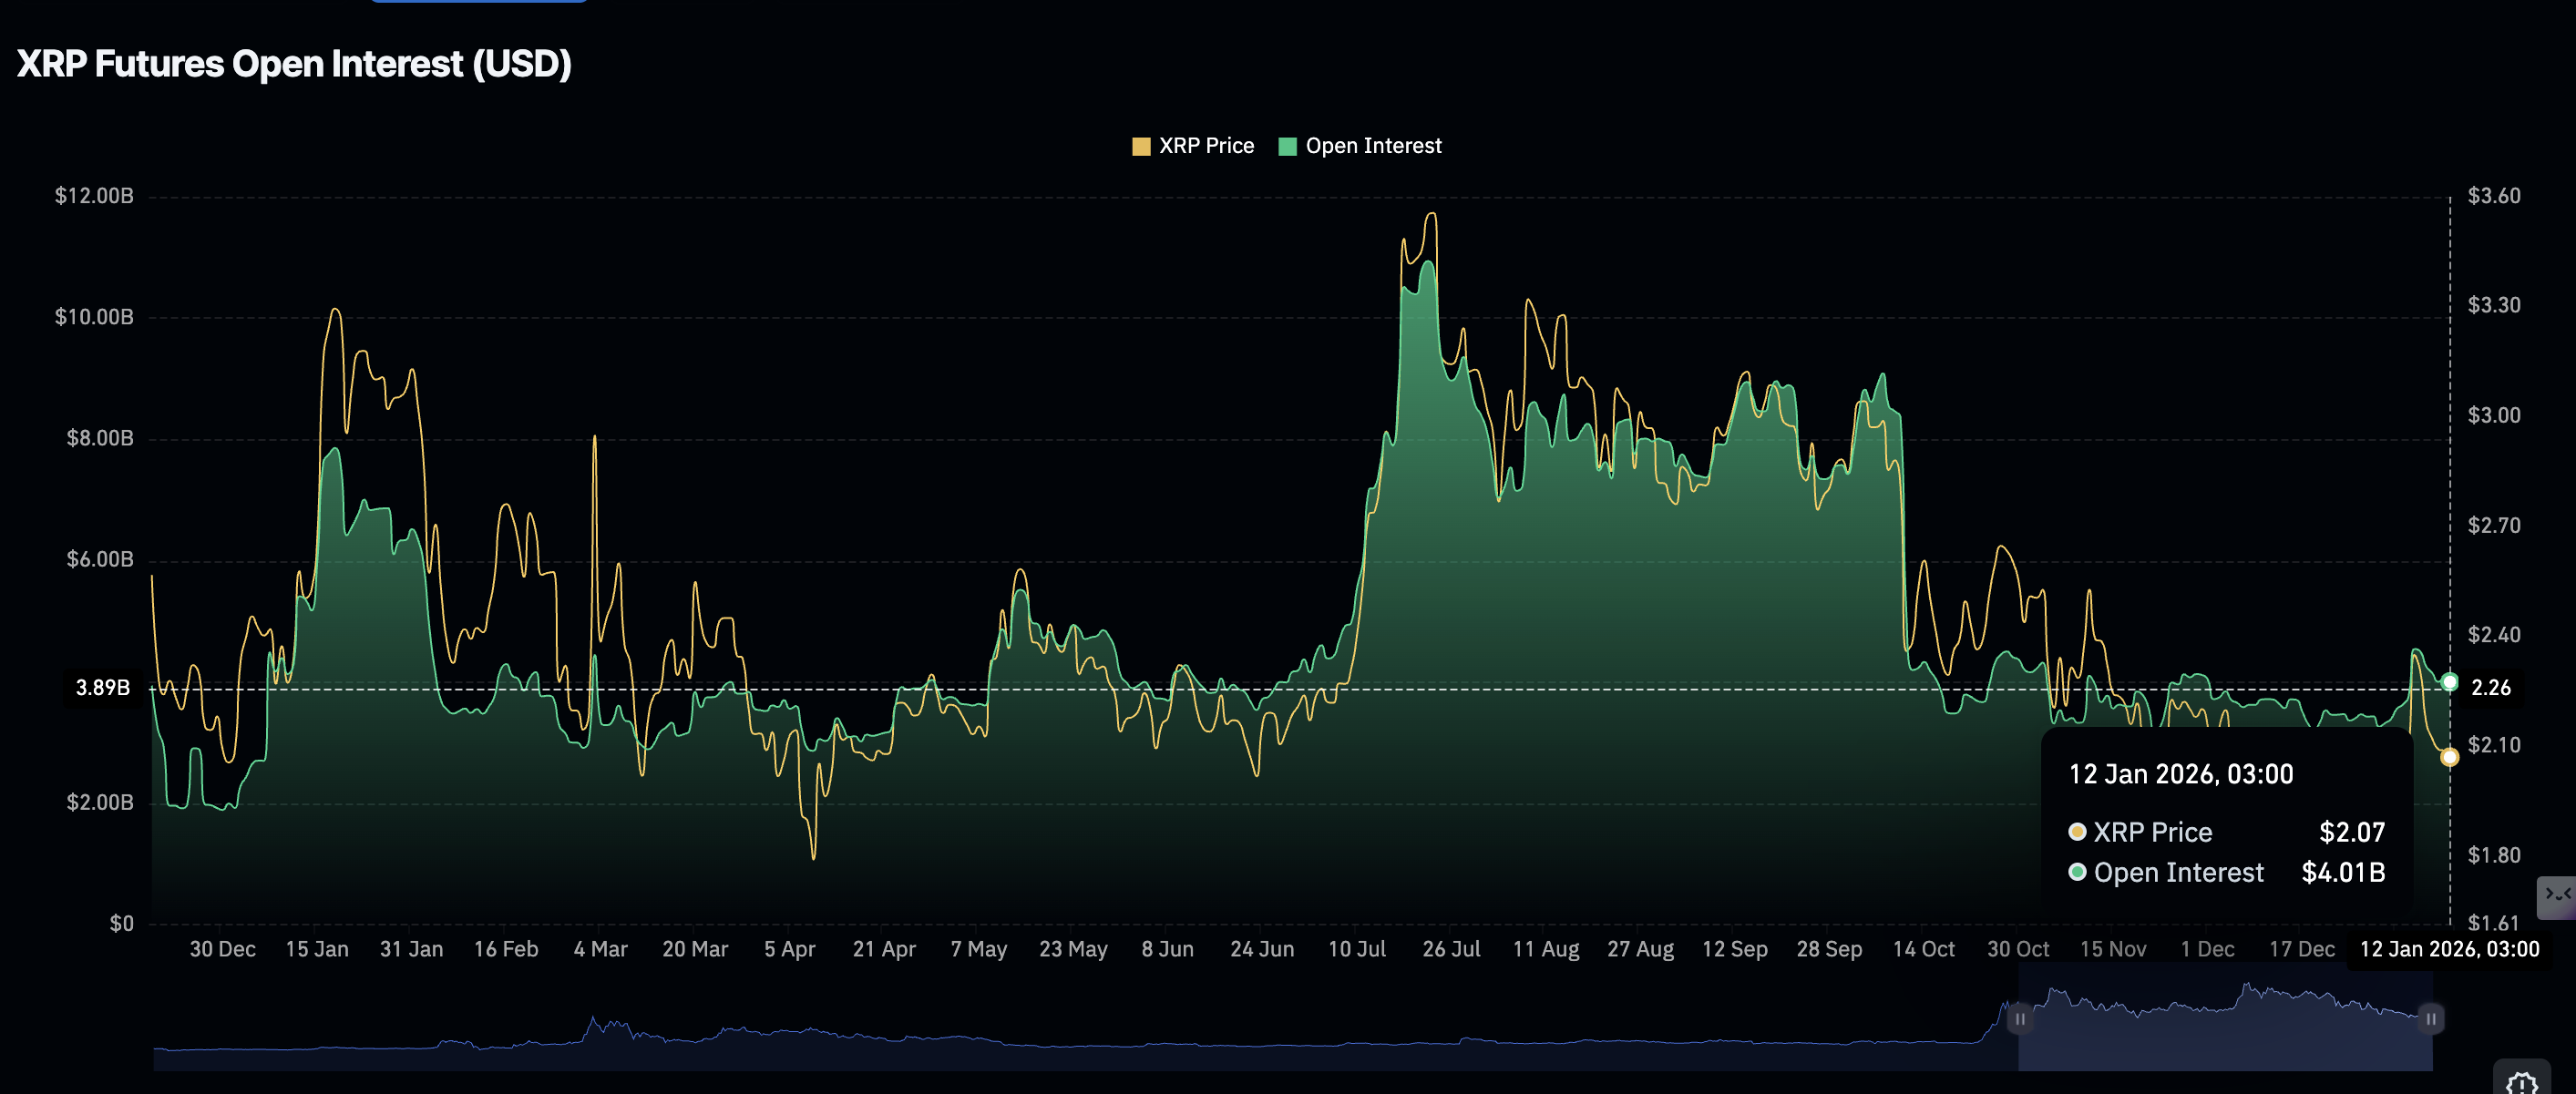
Meanwhile, XRP’s technical outlook remains weak, with the price sliding below the 50-day EMA at $2.07 at the time of writing on Monday. The RSI at 50 on the daily chart is falling toward the bearish region, indicating that bullish momentum is fading.
Traders should watch for a potential sell signal from the MACD indicator on the daily chart, as the blue line is poised to cross below the red signal line.
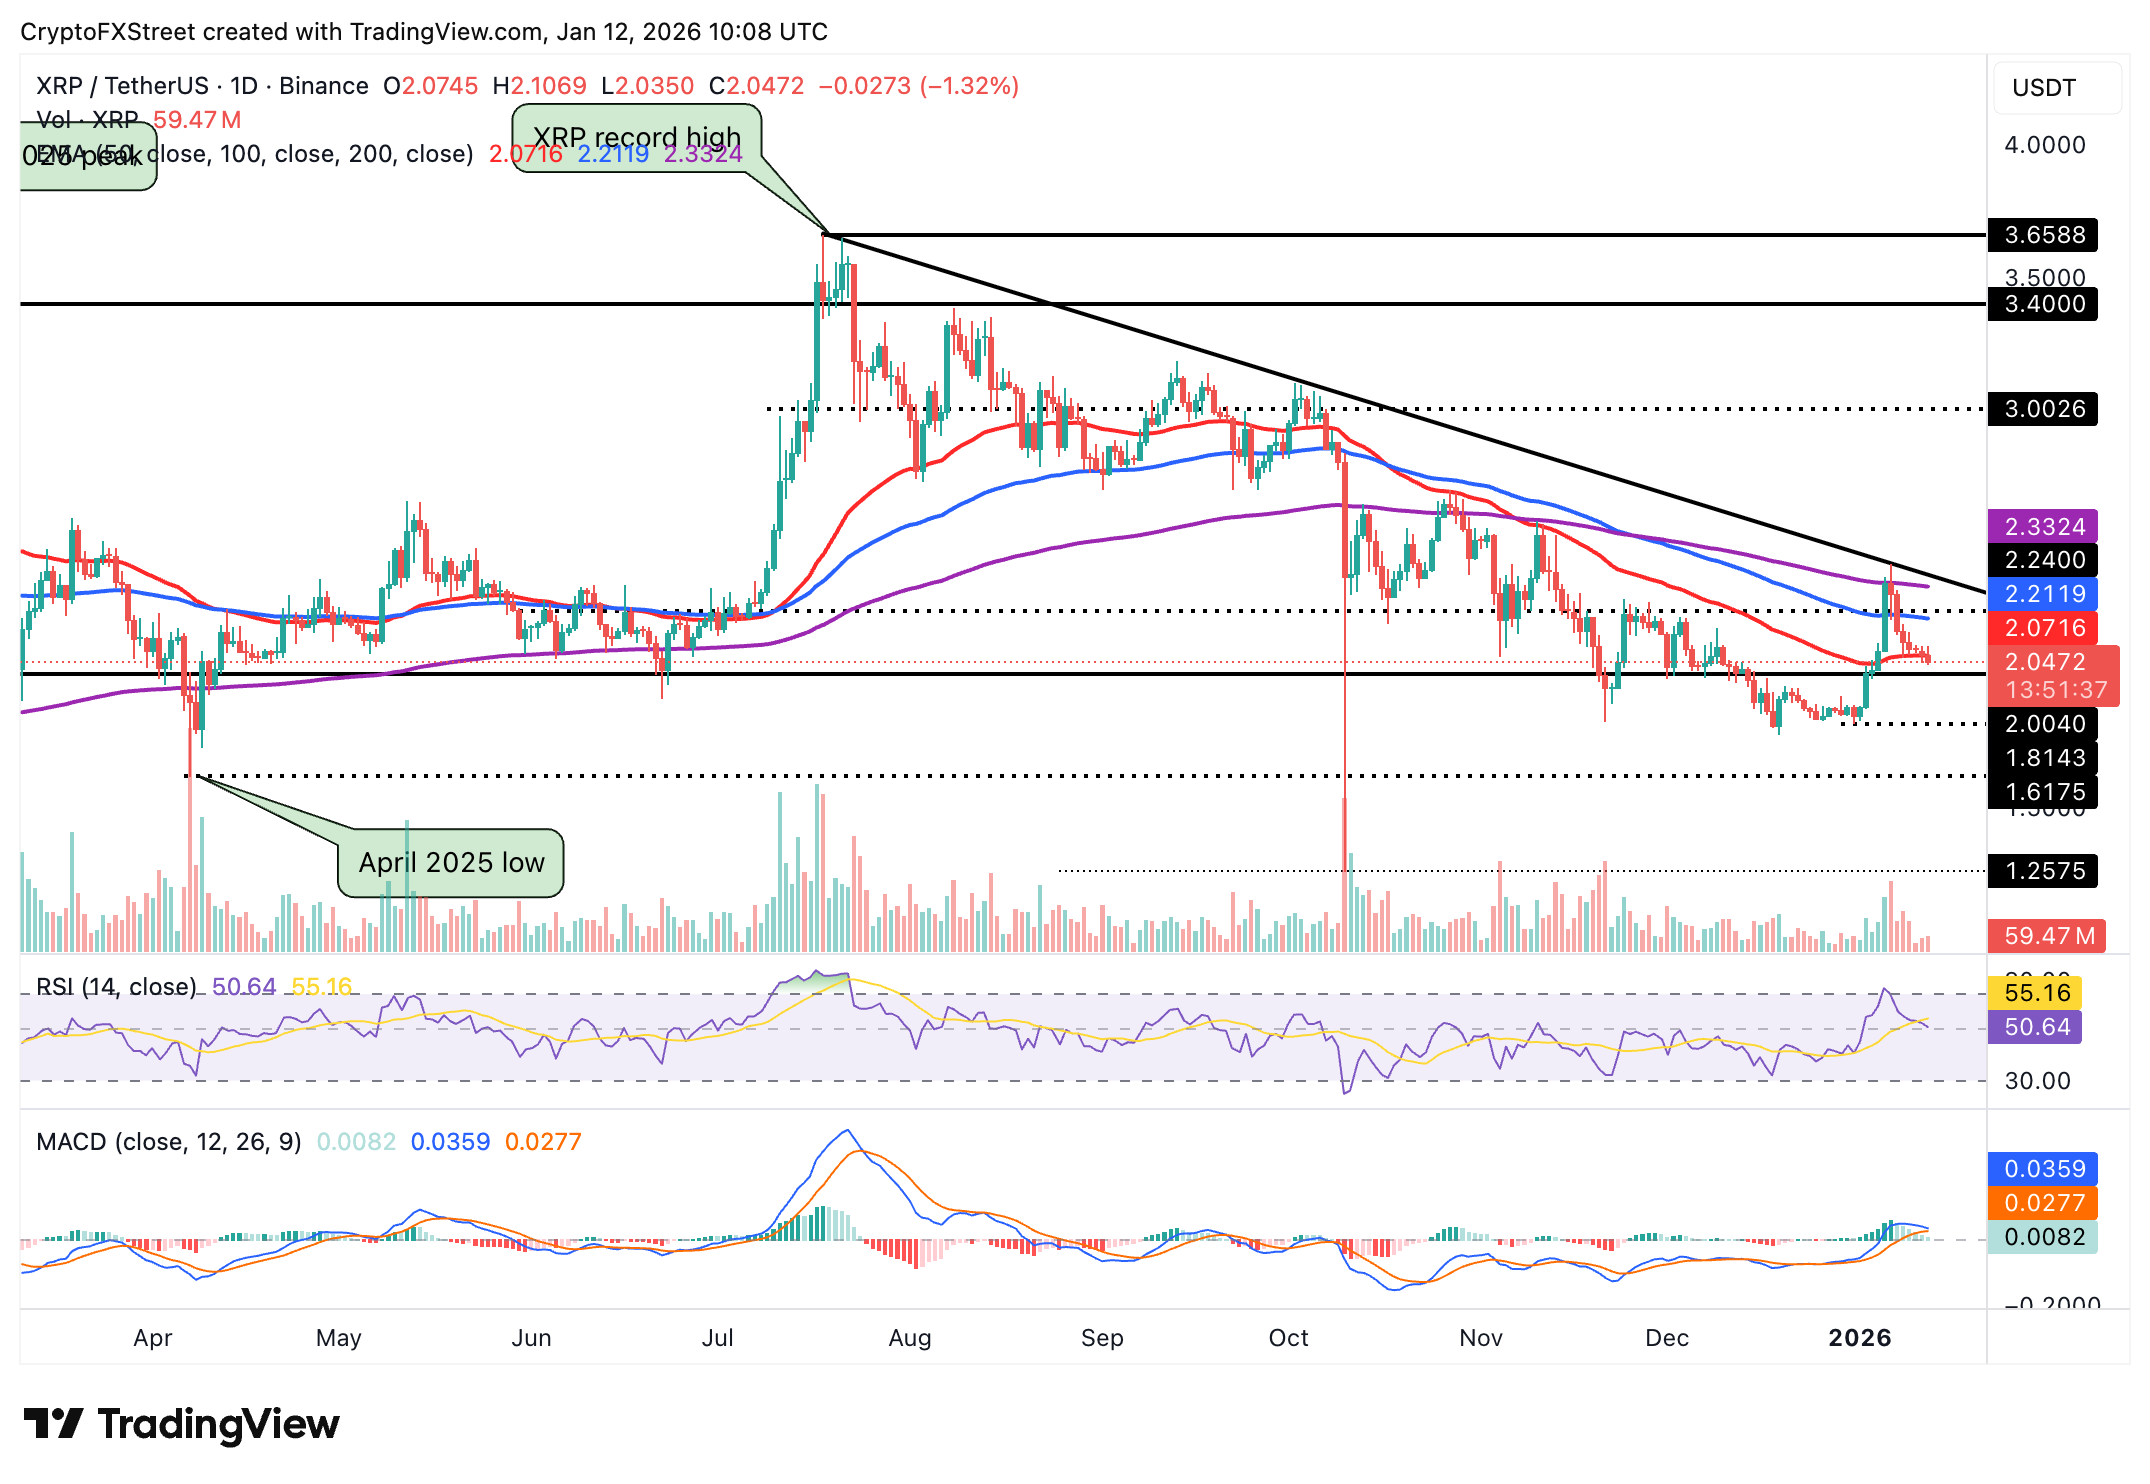
The pivotal $2.00 is the next key support level and may either trigger a rebound if bulls buy the dip, or pave the way for a continued correction toward the January 1 low of $1.82.
Open Interest, funding rate FAQs
Higher Open Interest is associated with higher liquidity and new capital inflow to the market. This is considered the equivalent of increase in efficiency and the ongoing trend continues. When Open Interest decreases, it is considered a sign of liquidation in the market, investors are leaving and the overall demand for an asset is on a decline, fueling a bearish sentiment among investors.
Funding fees bridge the difference between spot prices and prices of futures contracts of an asset by increasing liquidation risks faced by traders. A consistently high and positive funding rate implies there is a bullish sentiment among market participants and there is an expectation of a price hike. A consistently negative funding rate for an asset implies a bearish sentiment, indicating that traders expect the cryptocurrency’s price to fall and a bearish trend reversal is likely to occur.
Related Articles
Amazon Stock Predictions for 2026 to 2030: Will They Exceed Expectations and Achieve Major Long-Term Goals?
TradingKey - As we head into 2026, many investors are questioning where Amazon (AMZN) fits into the technology world.
A Crash After a Surge: Why Silver Lost 40% in a Week?
TradingKey - Spot silver (XAGUSD) prices continue to decline. Silver plunged 20% on Thursday, breaking below $71 per ounce, with the sell-off intensifying on Friday as prices fell further below $64. Compared to the all-time high set on January 29, silver prices have retraced more than 40%, wiping out nearly all gains accumulated over the previous month.
Google Cloud Revenue Surges 48% in Q4 as CapEx Guidance Nearly Doubles: Why the 7.5% After-Hours Dip?
TradingKey - After the close on February 4 (ET), Google (GOOG, GOOGL) released stellar Q4 results: total revenue grew 18% year-over-year, hitting a new quarterly record after revenue first surpassed $100 billion in Q3. The primary highlight was Google Cloud, where Q4 revenue surged 48% year-over-yea
Is Bitcoin’s Four-Year Cycle Dead in 2026?
Is the Bitcoin 4-year cycle dead? After 2025 broke historical records with a red post-halving year, institutional analysts explore if the Bitcoin price has decoupled from the halving countdown. Analyze the impact of spot ETFs, global liquidity, and the roadmap to the 2028 halving in this 2026 market

