

Crypto Today: Bitcoin, Ethereum, XRP risk further decline as market fear persists amid slowing demand

- Bitcoin holds $90,000 but stays below the 50-day EMA as institutional demand wanes.
- Ethereum steadies above $3,000 but remains structurally weak due to ETF outflows.
- XRP ETFs resume inflows, but the price struggles to gain ground above key support.
Bitcoin (BTC) holds delicately above $90,000 at the time of writing on Friday, reflecting lethargic sentiment in the broader cryptocurrency market. An early-year rally hit a hurdle at $94,789 on Monday, prompting profit-taking and a correction to $89,311 on Thursday.
Ethereum (ETH) is also facing increasing headwinds as recovery above $3,000 becomes elusive. Ripple (XRP) is similarly trading under pressure with initial support at $2.00.
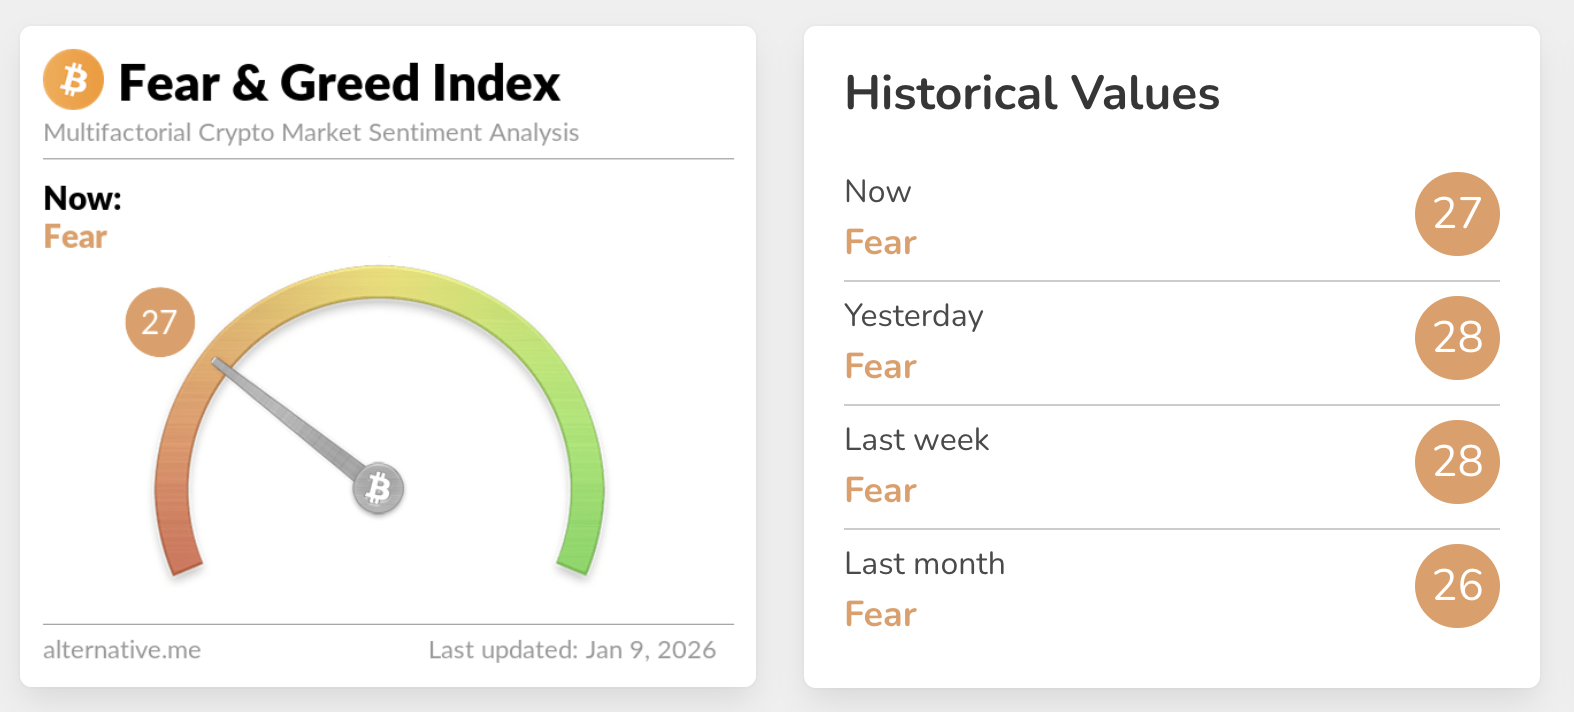
The broader cryptocurrency market remains fearful following the headwinds experienced this week. According to the Crypto Fear & Greed Index by Alternative, market sentiment has remained in fear since the October flash crash.
On the other hand, fear can signal that investors are overly worried, which can often create buying opportunities. However, if the sell-off persists amid growing macroeconomic uncertainty, the crypto market could decline further.
Bitcoin, Ethereum ETFs face low demand, XRP resumes outflows
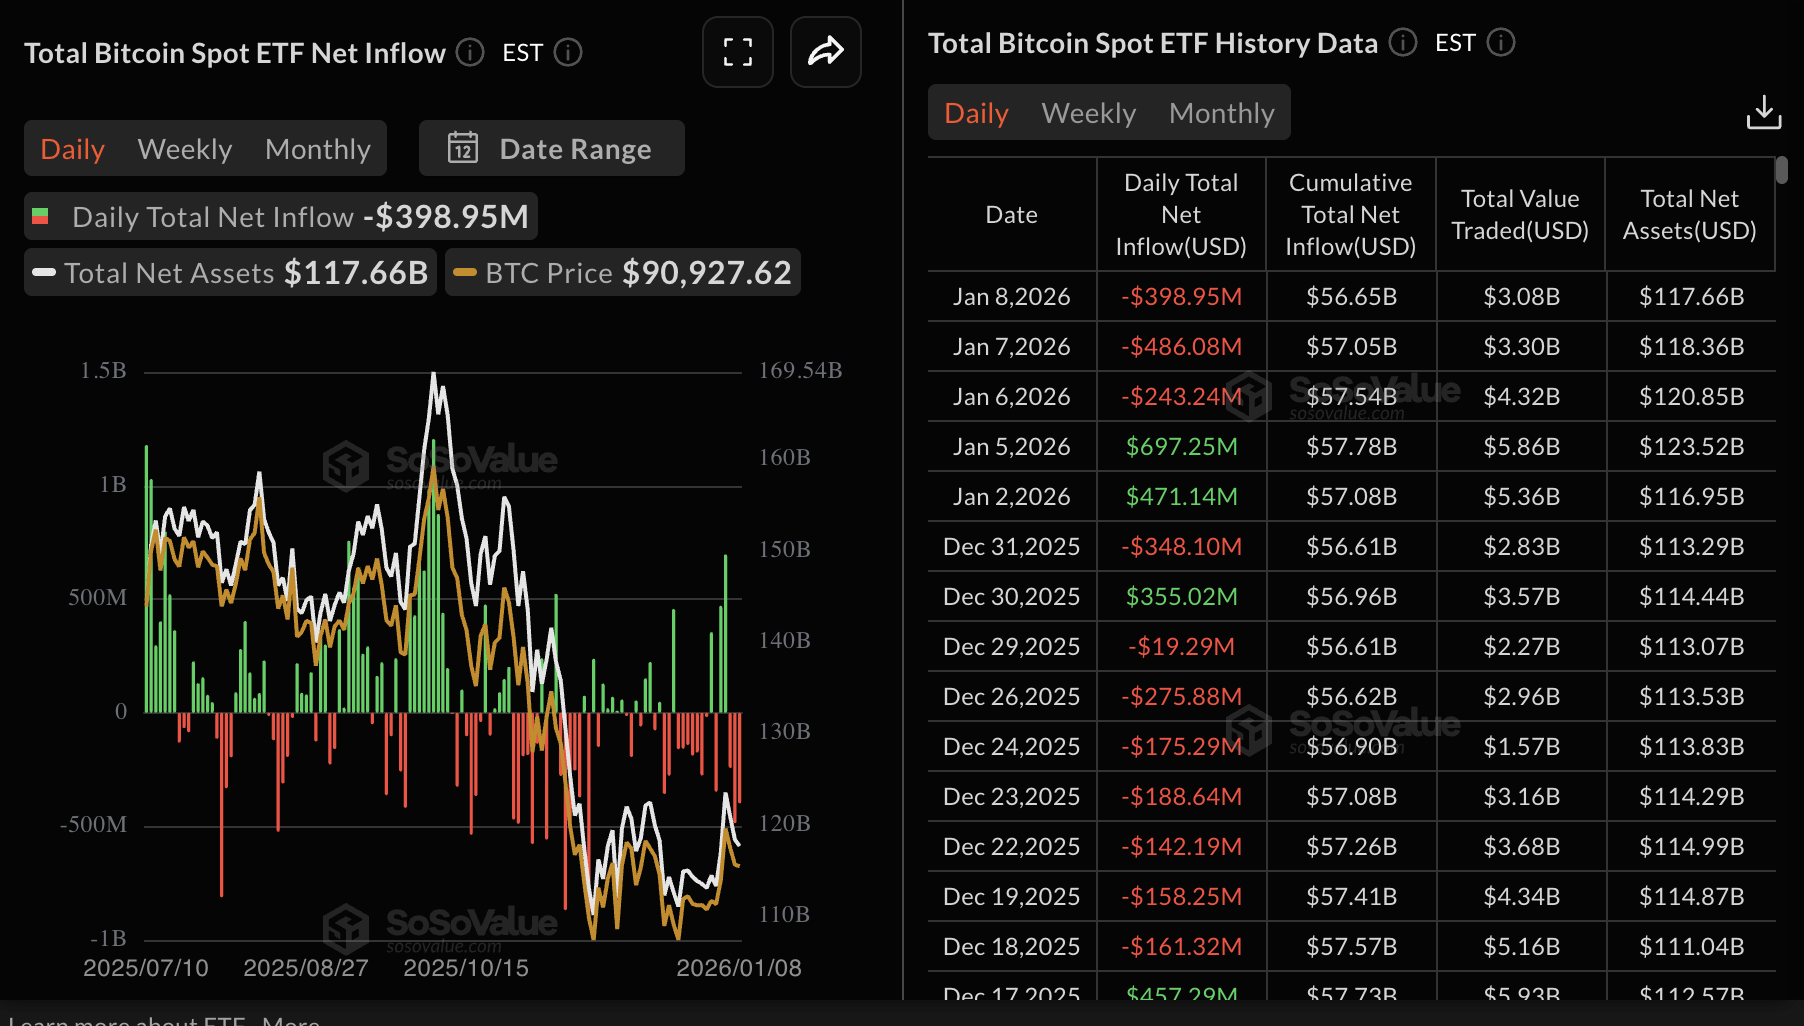
Bitcoin spot Exchange Traded Funds (ETFs) recorded outflows of nearly $398 million on Thursday, as risk-off sentiment persisted for the third consecutive day. Only two of the nine ETFs listed in the United States (US) experienced inflows, including Bitwise’s BITB with $2.96 million and WisdomTree’s BTCW with $1.92 million. The cumulative inflow stands at $56.65 billion and net assets at $117.66 billion, according to SoSoValue data.
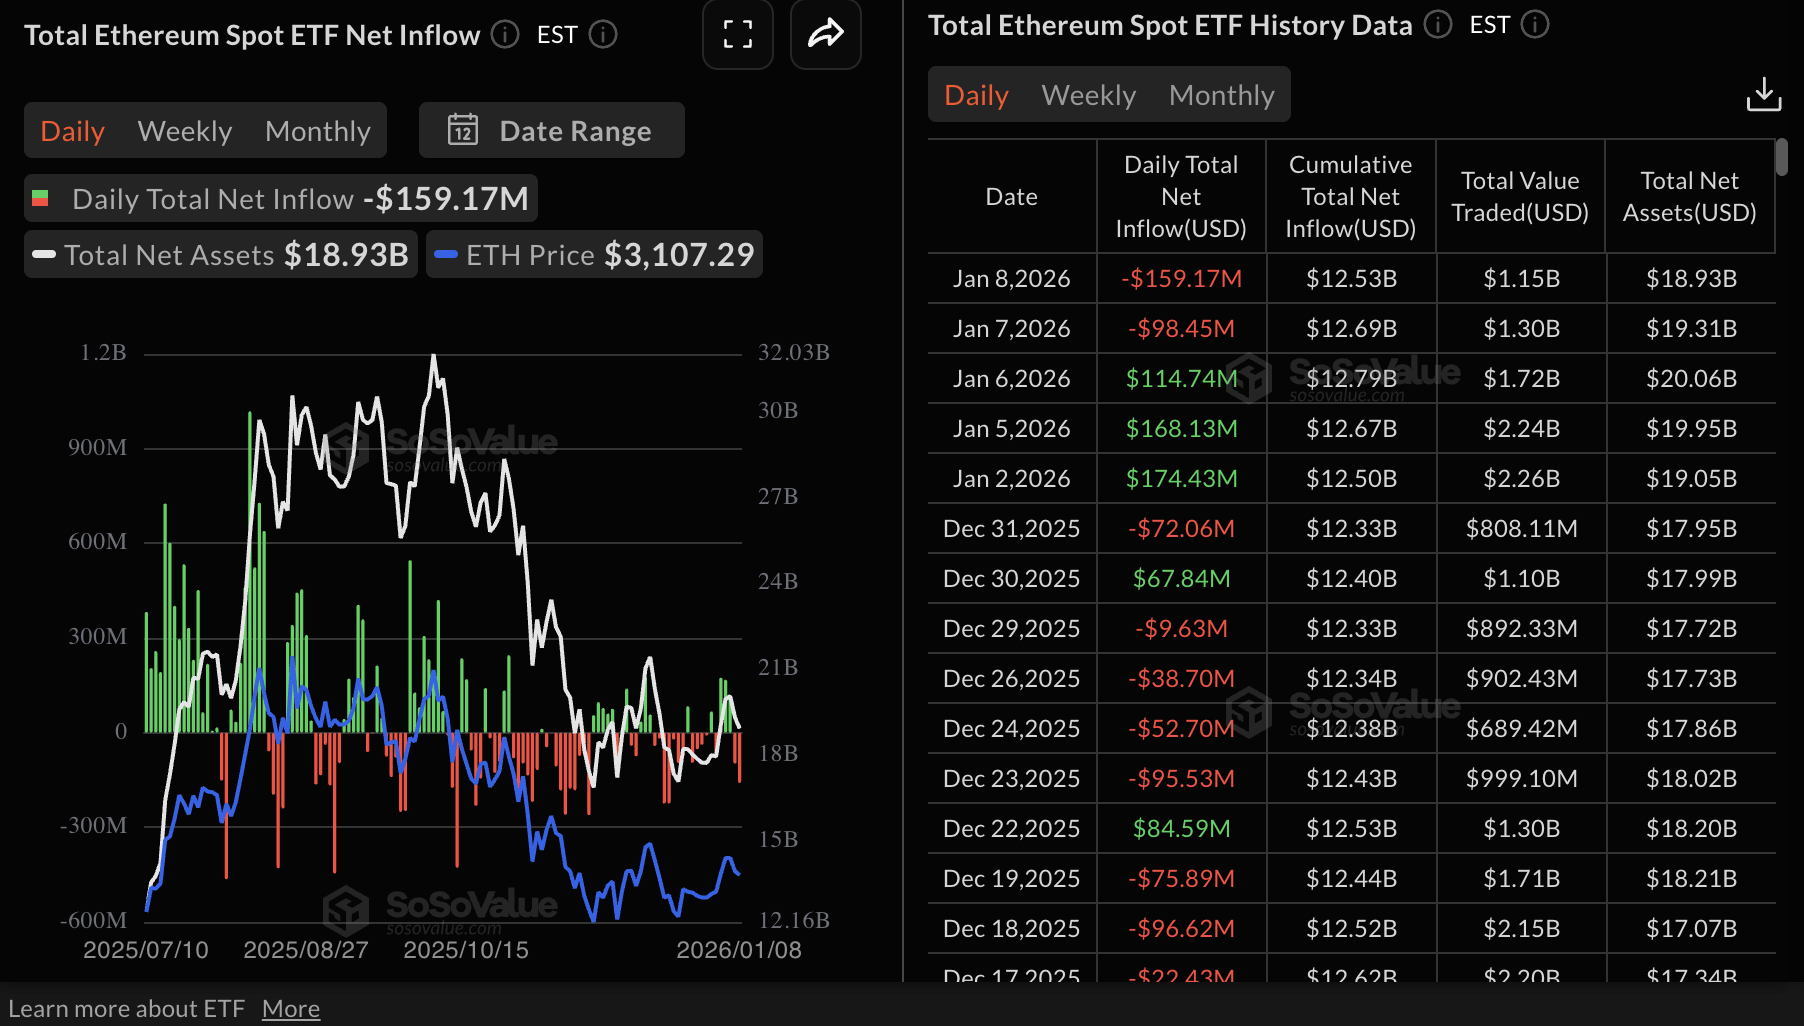
Ethereum ETFs extended their outflow streak for the second consecutive day, as investors withdrew approximately $159 million on Thursday. The US-listed ETFs had seen a positive turnaround at the start of the year, drawing $174 million last Friday, $168 million on Monday and $115 million on Tuesday. The cumulative inflow stands at $12.53 billion and net assets at $18.93 billion.
Meanwhile, XRP ETFs resumed inflows with nearly $9 million recorded on Thursday. The US-listed spot ETFs had posted their first outflow of approximately $41 million on Wednesday. The cumulative inflow stands at $1.21 billion, and net assets at $1.49 billion.
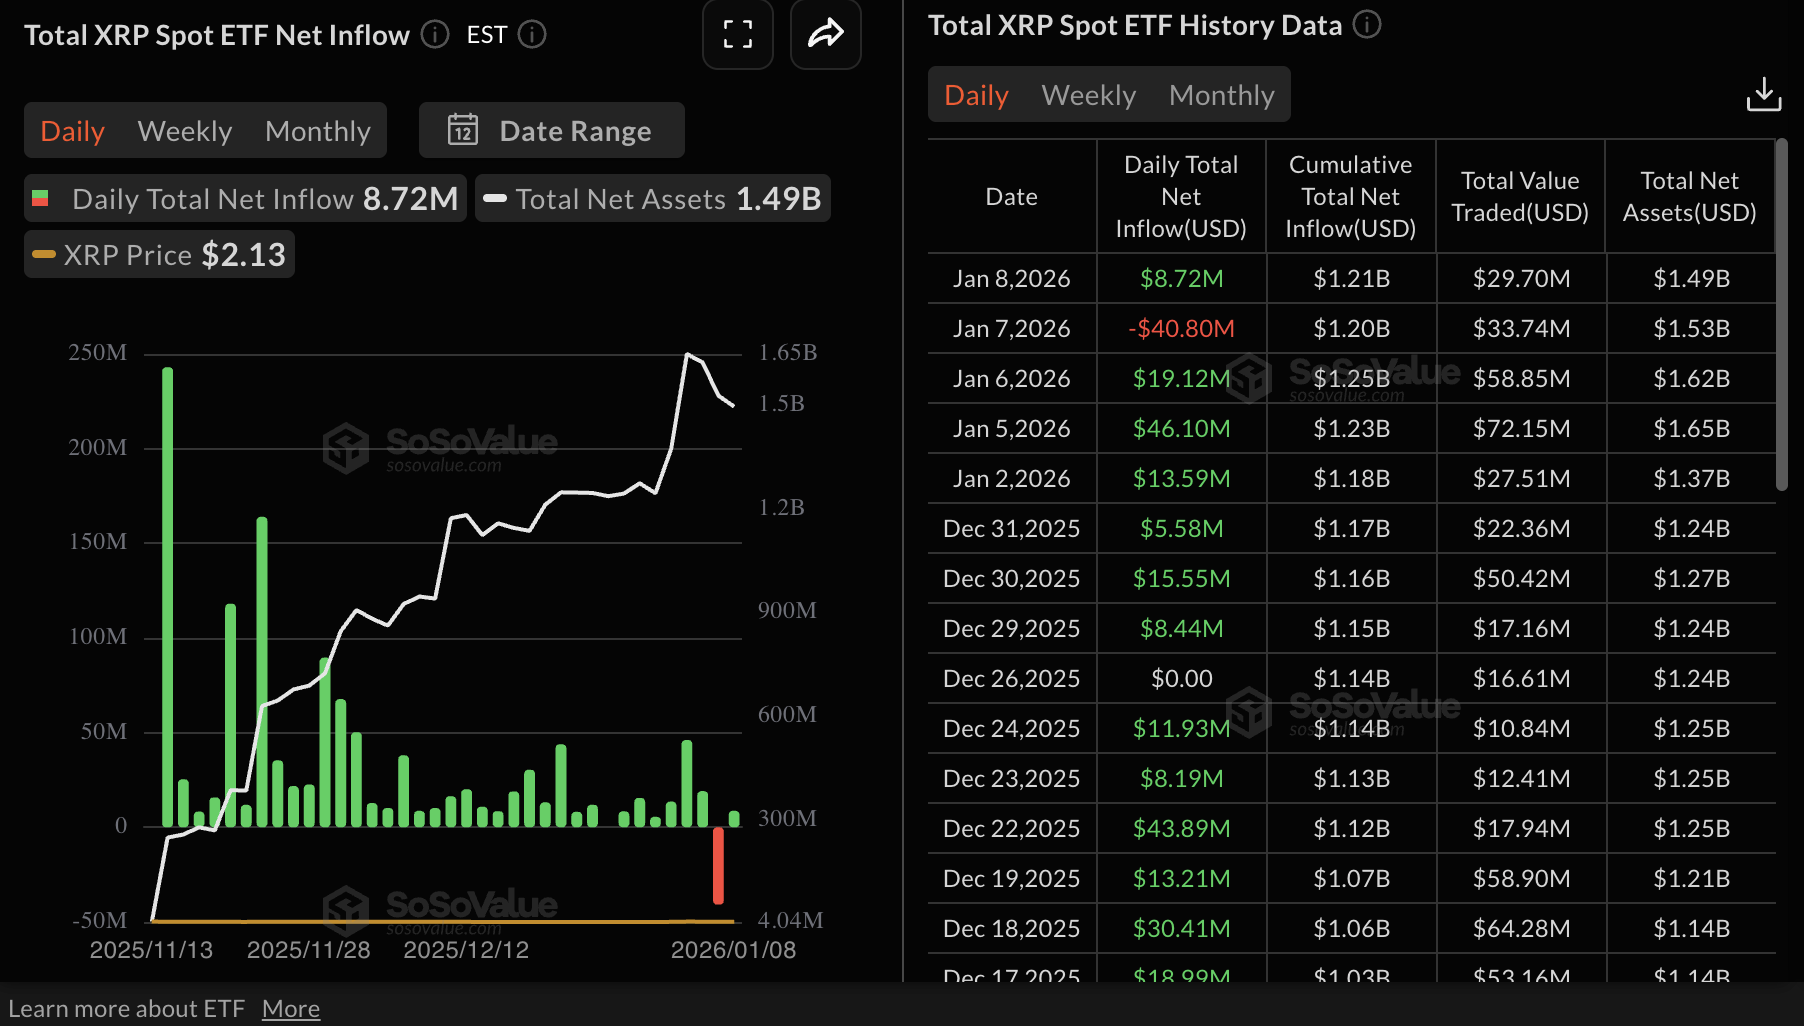
Chart of the day: Bitcoin tests $90,000 support
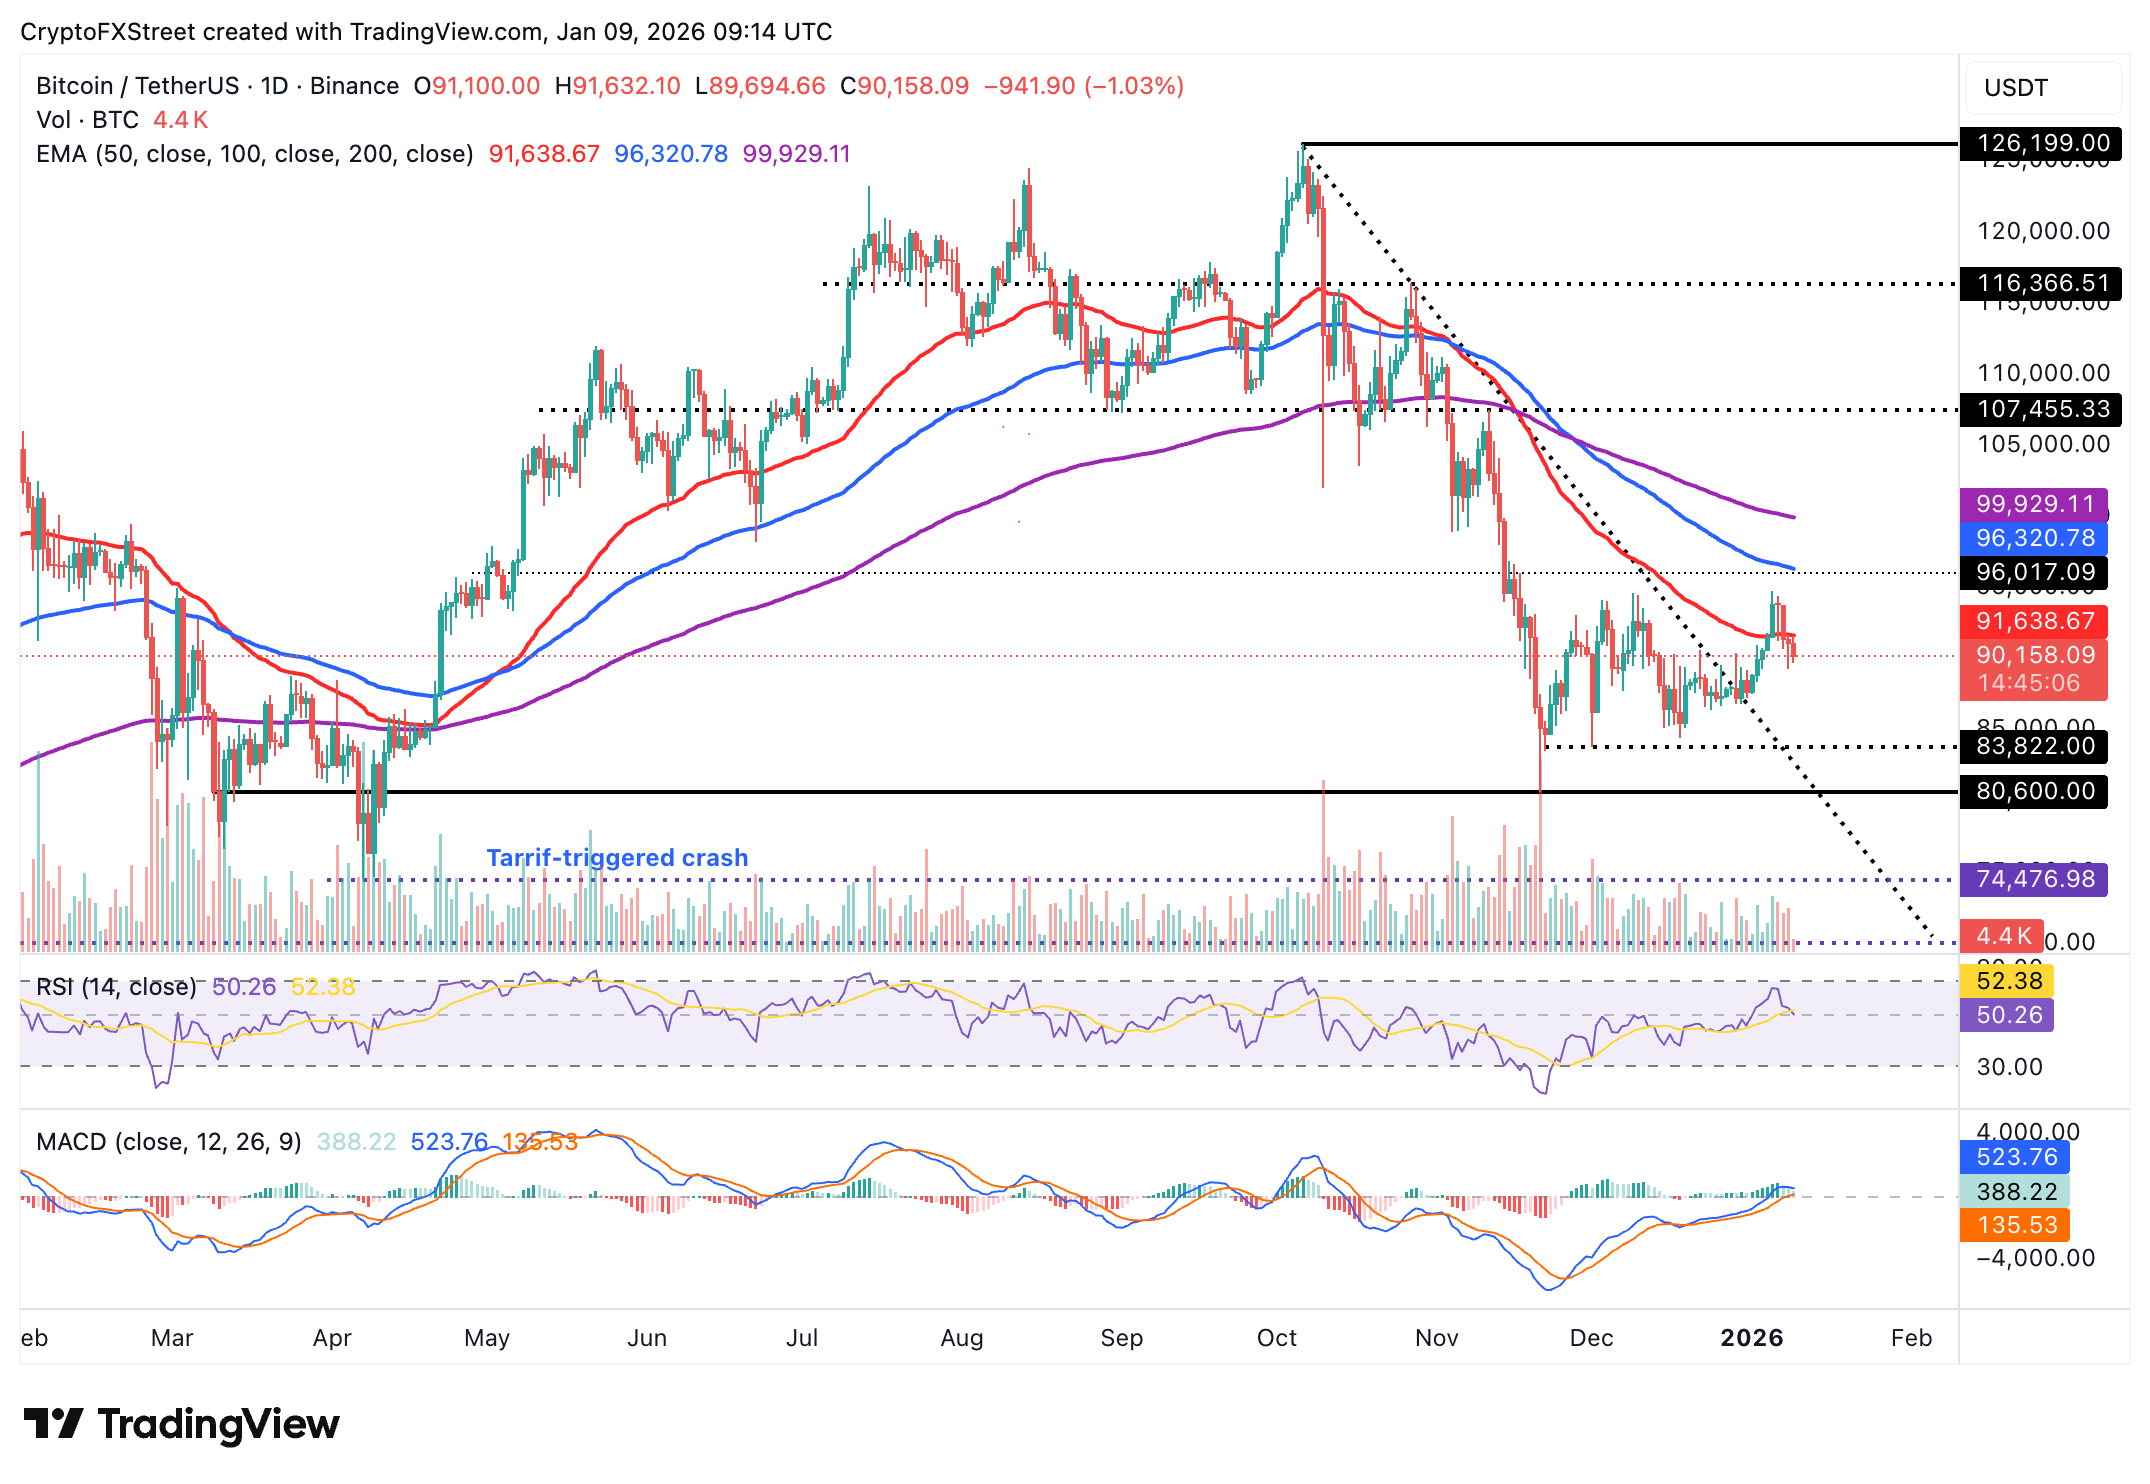
Bitcoin is trading marginally above $90,000 at the time of writing on Friday. The Relative Strength Index (RSI) at 50 on the daily chart is likely to extend the decline into the bearish territory, potentially exacerbating selling pressure below $90,000.
Despite the Moving Average Convergence Divergence (MACD) indicator on the same chart showing a slight positive divergence, the green histogram bars are fading, suggesting that bullish momentum is waning.
The 50-day Exponential Moving Average (EMA) at $91,638 caps BTC’s upside while the 100-day EMA at $96,320 and the 100-day EMA at $99,929 are sloping downward, emphasising the overall downtrend.
A close below $90,000 could accelerate the fall, with fear gripping the crypto market amid persistent ETF outflows, as outlined above.
Altcoins technical outlook: Ethereum, XRP face increasing pressure
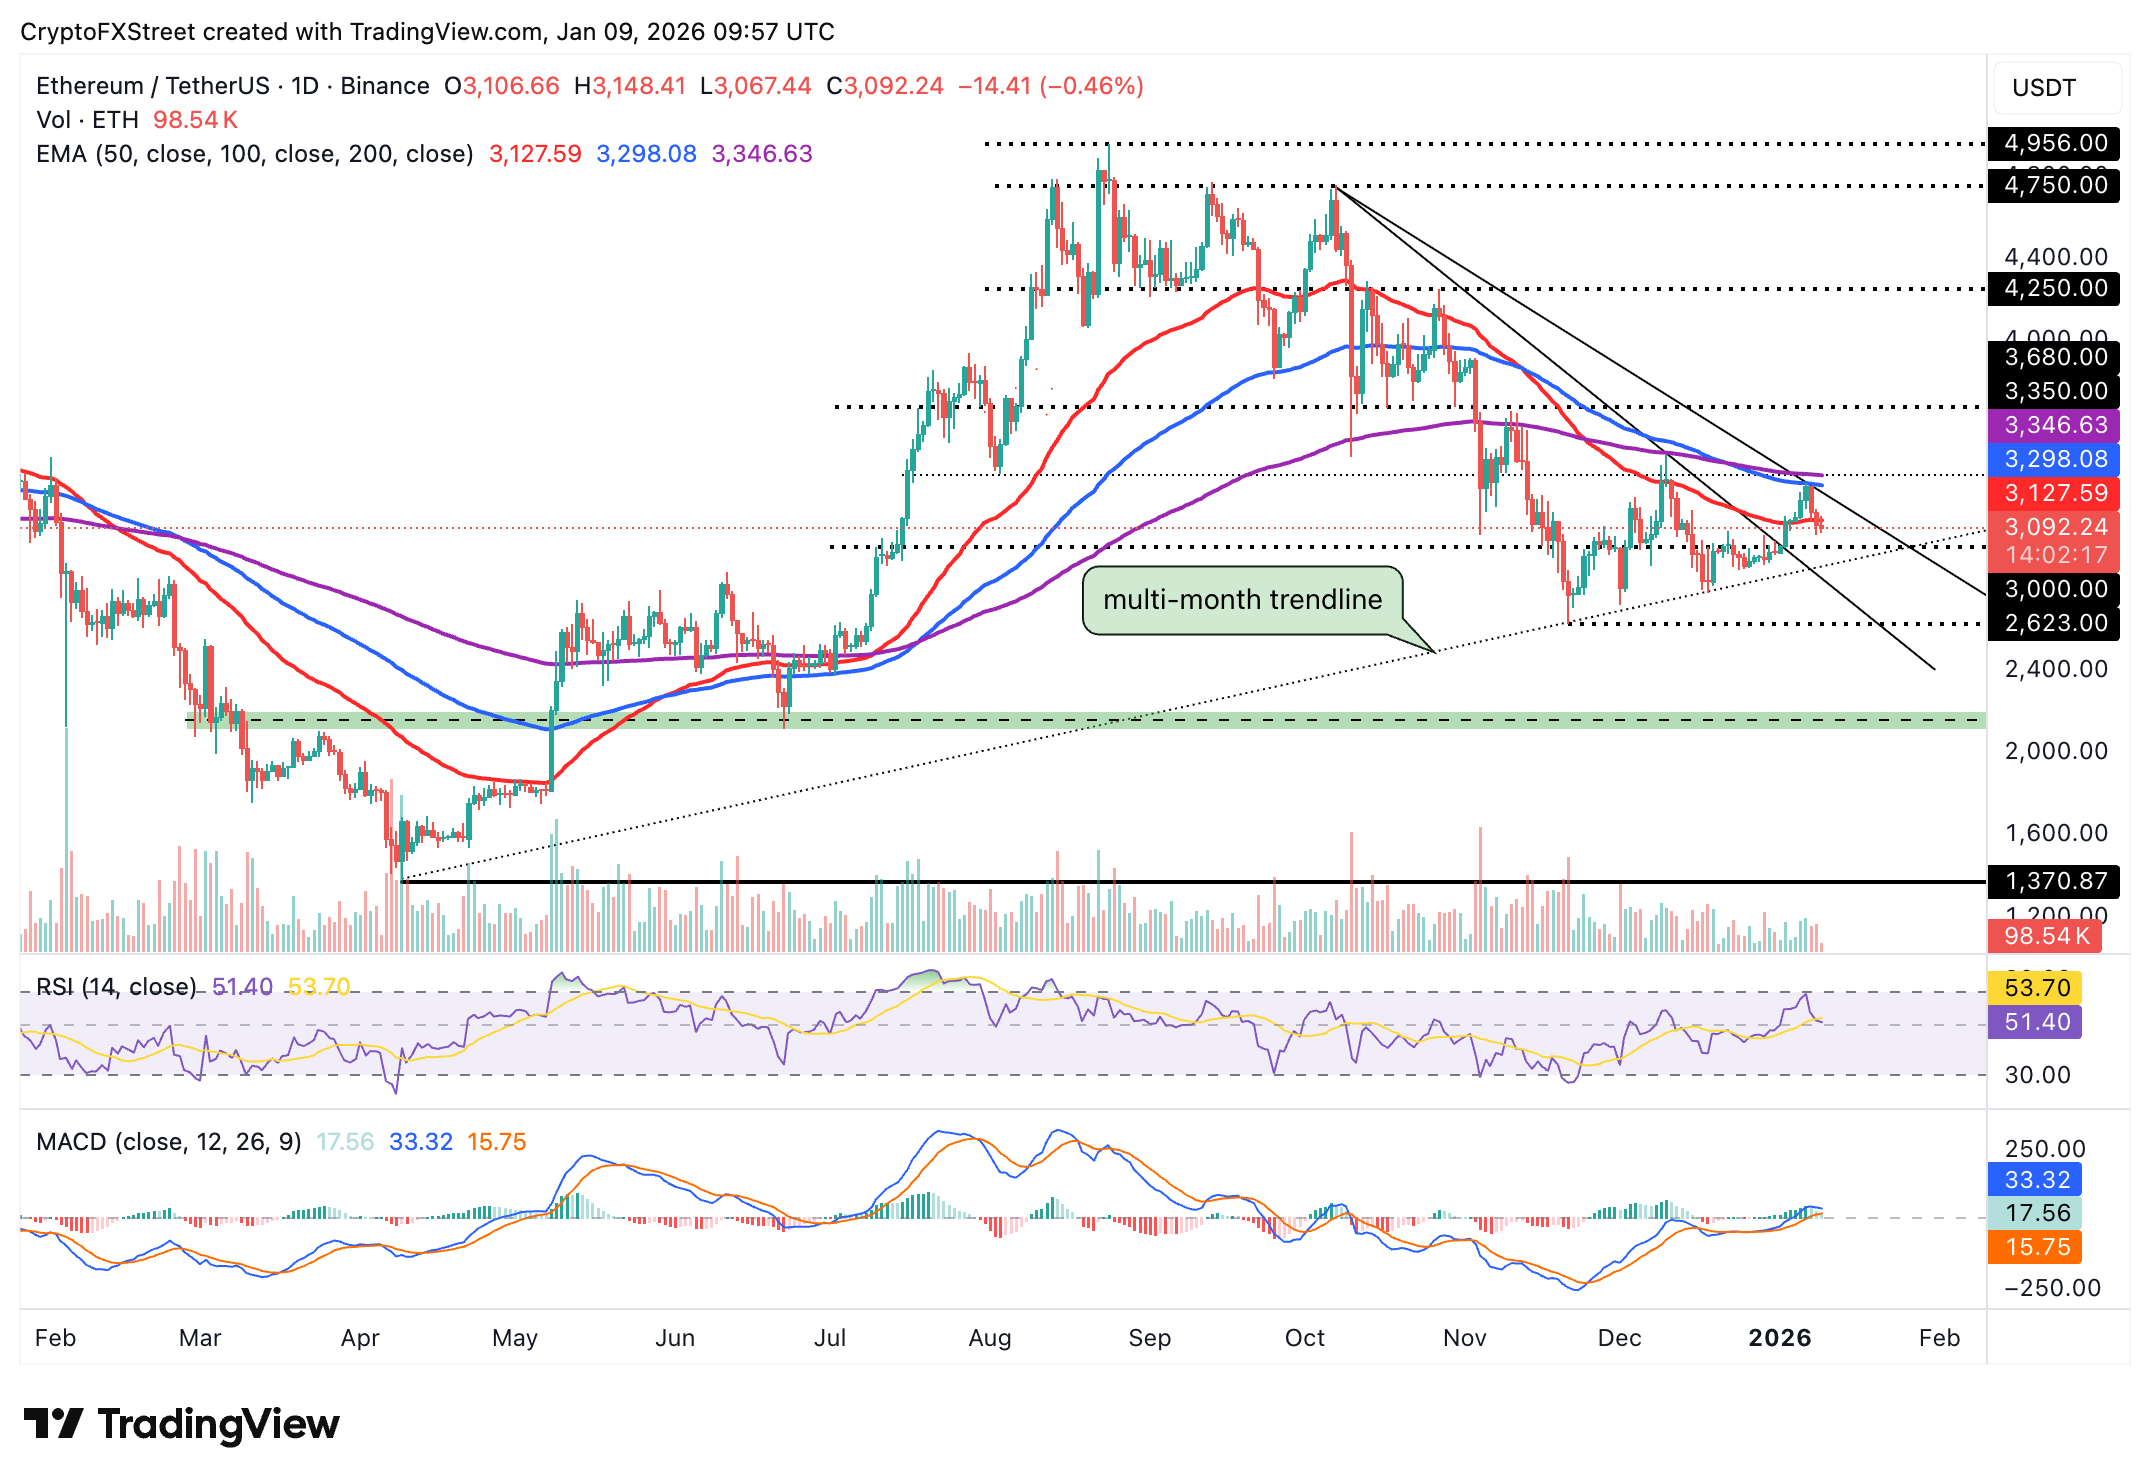
Ethereum is trading above $3,000 but remains below the 50-day EMA at $3,127. The RSI at 51 on the daily chart continues to show weakness, indicating that bullish momentum is fading.
The MACD indicator in the same time frame is starting to reverse toward the mean line, as the green histogram bars fade. If this trend persists, it could prompt investors to further reduce exposure, adding to the headwinds.
Support at $3,000 remains critical for the resumption of the uptrend. However, if broken, Ethereum may drop to test the ascending trendline and the November low of $2,623.
Still, a knee-jerk trend reversal could occur if bulls buy the dip. Here, a close above the 100-day EMA at $3,298 and the 200-day EMA at $3,346 would confirm a bullish turnaround.
As for XRP, recovery has remained elusive since the rejection from a weekly high of $2.41 on Tuesday. The cross-border remittance token is trading at $2.10 at the time of writing on Friday and testing the 50-day EMA support at $2.07.
The RSI at 54 on the daily chart continues to extend its decline from overbought territory, suggesting that bullish momentum is faltering. A close above the 50-day EMA could support the resumption of the uptrend, with a sustained break above the 100-day EMA at $2.22 likely to confirm XRP’s bullish outlook. The 200-day EMA at $2.34 caps the upside along with a descending trendline.
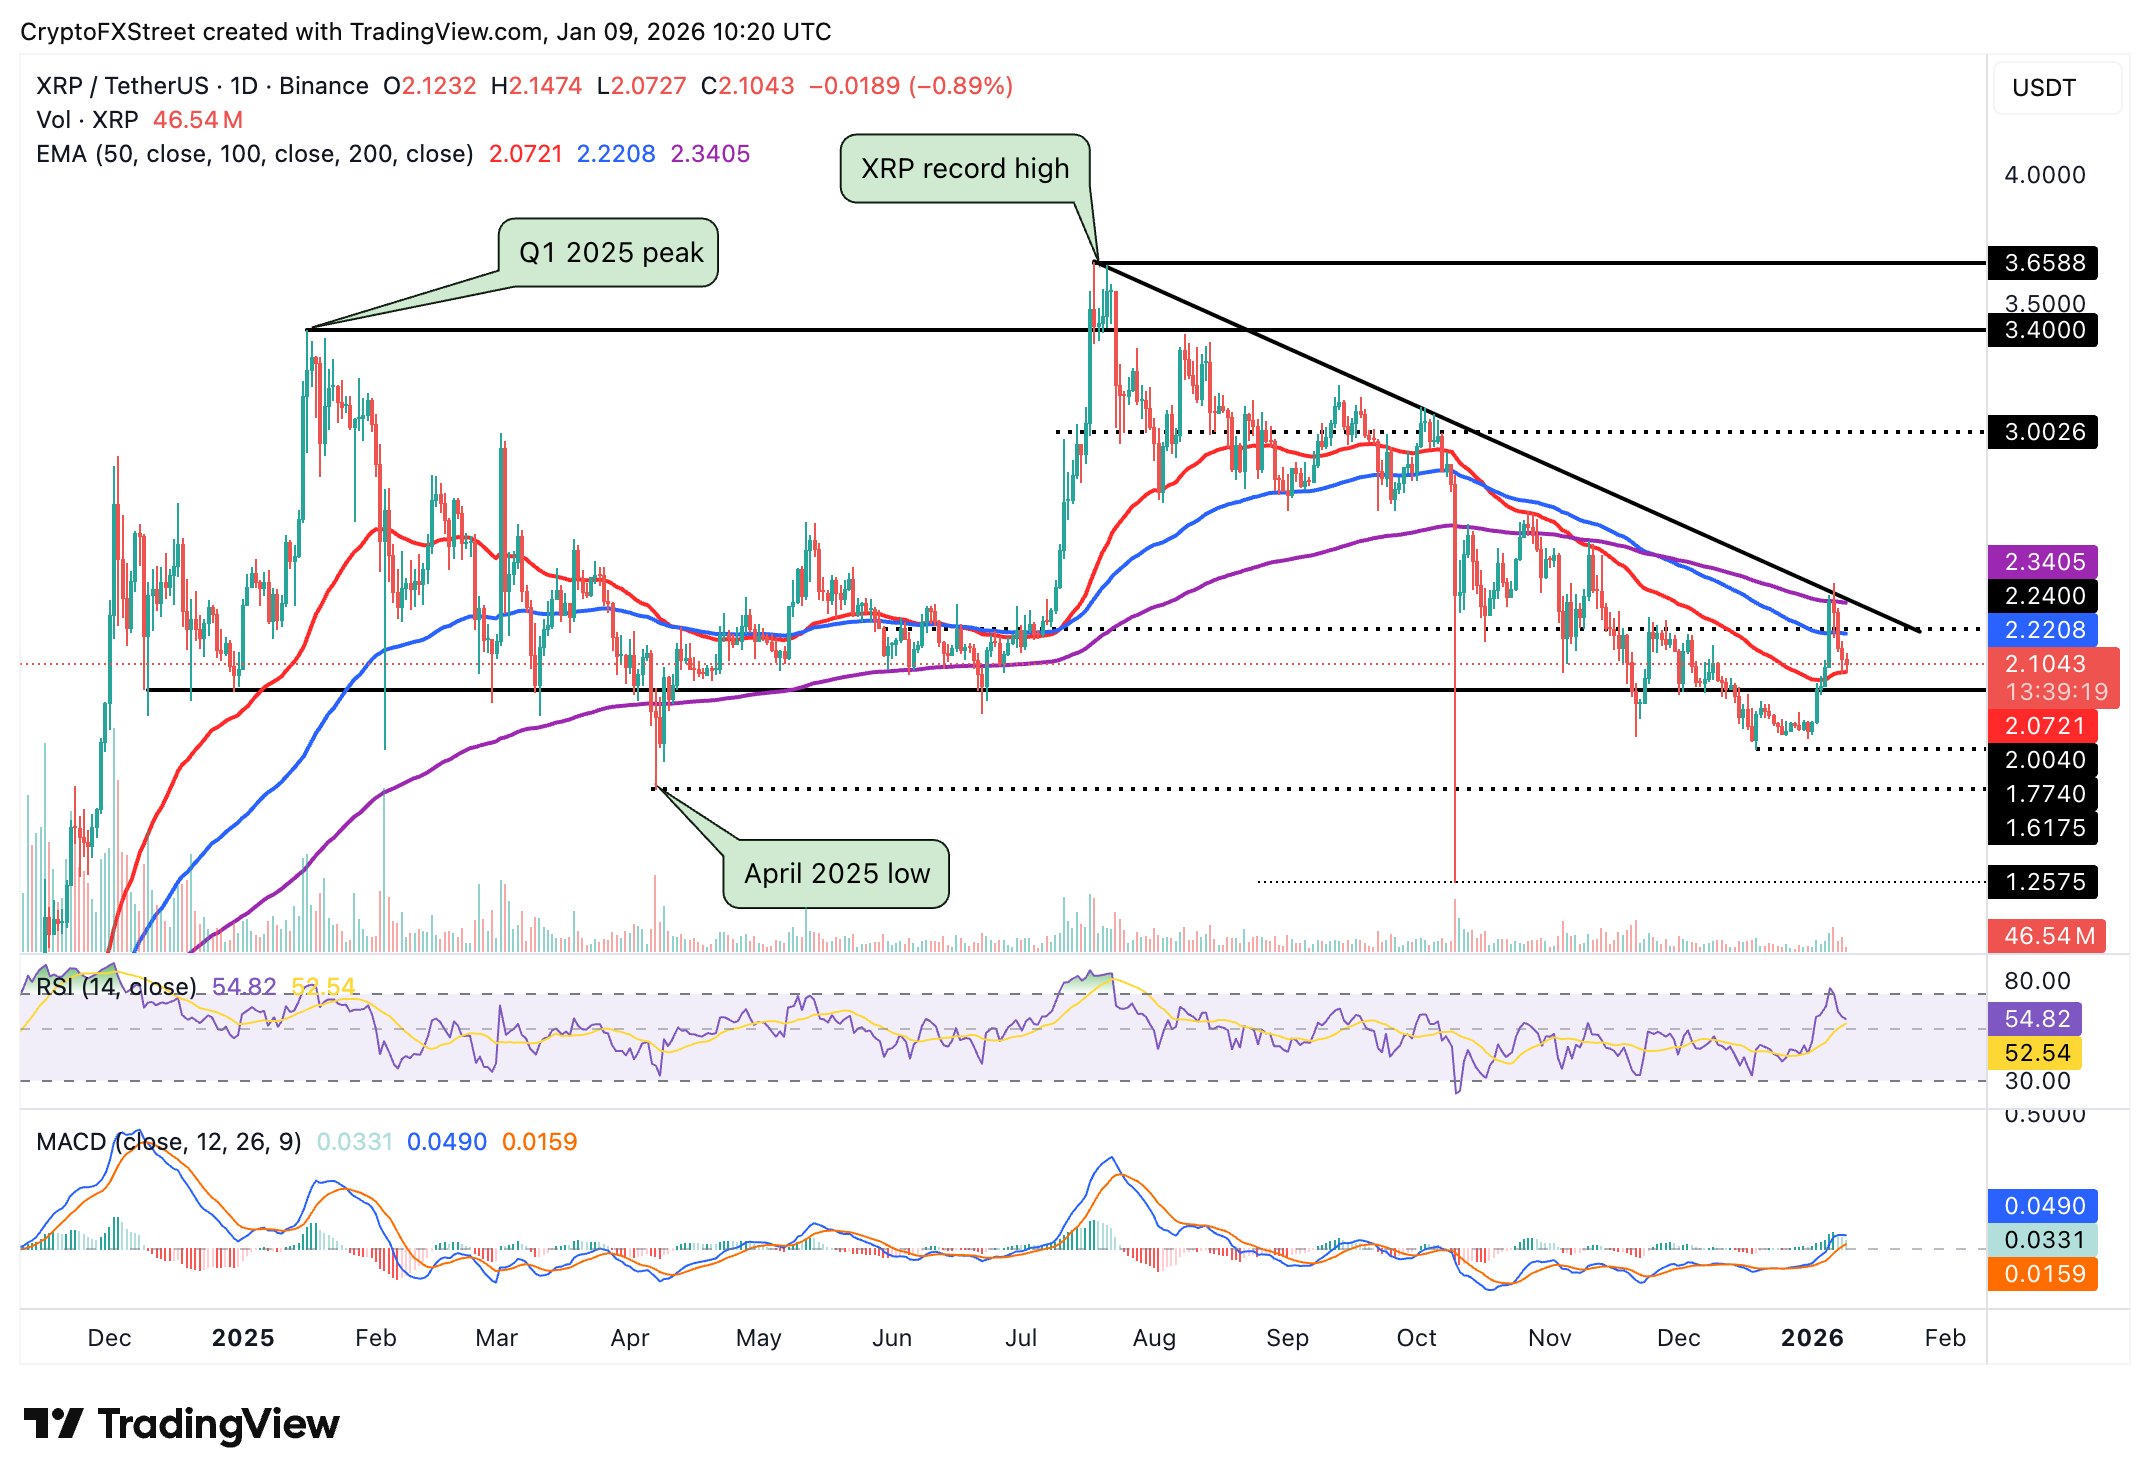
Still, the MACD indicator has maintained a buy signal since January 1, which could keep investors interested in the token. However, the fading green histogram bars signal that the downtrend could persist in the short term, with a close below the 50-day EMA likely to extend the downtrend below $2.00.
Cryptocurrency metrics FAQs
The developer or creator of each cryptocurrency decides on the total number of tokens that can be minted or issued. Only a certain number of these assets can be minted by mining, staking or other mechanisms. This is defined by the algorithm of the underlying blockchain technology. On the other hand, circulating supply can also be decreased via actions such as burning tokens, or mistakenly sending assets to addresses of other incompatible blockchains.
Market capitalization is the result of multiplying the circulating supply of a certain asset by the asset’s current market value.
Trading volume refers to the total number of tokens for a specific asset that has been transacted or exchanged between buyers and sellers within set trading hours, for example, 24 hours. It is used to gauge market sentiment, this metric combines all volumes on centralized exchanges and decentralized exchanges. Increasing trading volume often denotes the demand for a certain asset as more people are buying and selling the cryptocurrency.
Funding rates are a concept designed to encourage traders to take positions and ensure perpetual contract prices match spot markets. It defines a mechanism by exchanges to ensure that future prices and index prices periodic payments regularly converge. When the funding rate is positive, the price of the perpetual contract is higher than the mark price. This means traders who are bullish and have opened long positions pay traders who are in short positions. On the other hand, a negative funding rate means perpetual prices are below the mark price, and hence traders with short positions pay traders who have opened long positions.
Related Articles
Amazon Stock Predictions for 2026 to 2030: Will They Exceed Expectations and Achieve Major Long-Term Goals?
TradingKey - As we head into 2026, many investors are questioning where Amazon (AMZN) fits into the technology world.
A Crash After a Surge: Why Silver Lost 40% in a Week?
TradingKey - Spot silver (XAGUSD) prices continue to decline. Silver plunged 20% on Thursday, breaking below $71 per ounce, with the sell-off intensifying on Friday as prices fell further below $64. Compared to the all-time high set on January 29, silver prices have retraced more than 40%, wiping out nearly all gains accumulated over the previous month.
Is Bitcoin’s Four-Year Cycle Dead in 2026?
Is the Bitcoin 4-year cycle dead? After 2025 broke historical records with a red post-halving year, institutional analysts explore if the Bitcoin price has decoupled from the halving countdown. Analyze the impact of spot ETFs, global liquidity, and the roadmap to the 2028 halving in this 2026 market
USD Dollar Trend Forecast: Dollar Index Falls Below 97.0 to 4-Year Low, Will the Dollar Continue To Fall or Bottom Out in 2026?
TradingKey - In January 2026, the US Dollar Index continued its downward trend from 2025, officially breaking below the key 97.0 level and reaching a low of 95.5, marking a nearly four-year low since February 2022.

