

Cardano struggles to extend gains as retail interest wanes despite Midnight's NIGHT token launch

- Cardano ticks higher after a bearish weekend, struggling to extend an upcycle within a descending wedge pattern.
- On-chain data shows an increase in trading volume and user activity after the Midnight side chain token launch.
- A negative funding rate and declining futures Open Interest suggest faltering retail interest.
Cardano (ADA) recovers over 2% at press time on Monday, struggling to extend gains within a descending wedge pattern. Despite the larger declining trend, Cardano’s network has seen a surge in on-chain volume over the last two weeks with the launch of its privacy-focused sidechain, Midnight network. Still, the derivatives data indicate a sell-side dominance among traders.
Bearish sentiment persists as post-Midnight launch boosts trading volume
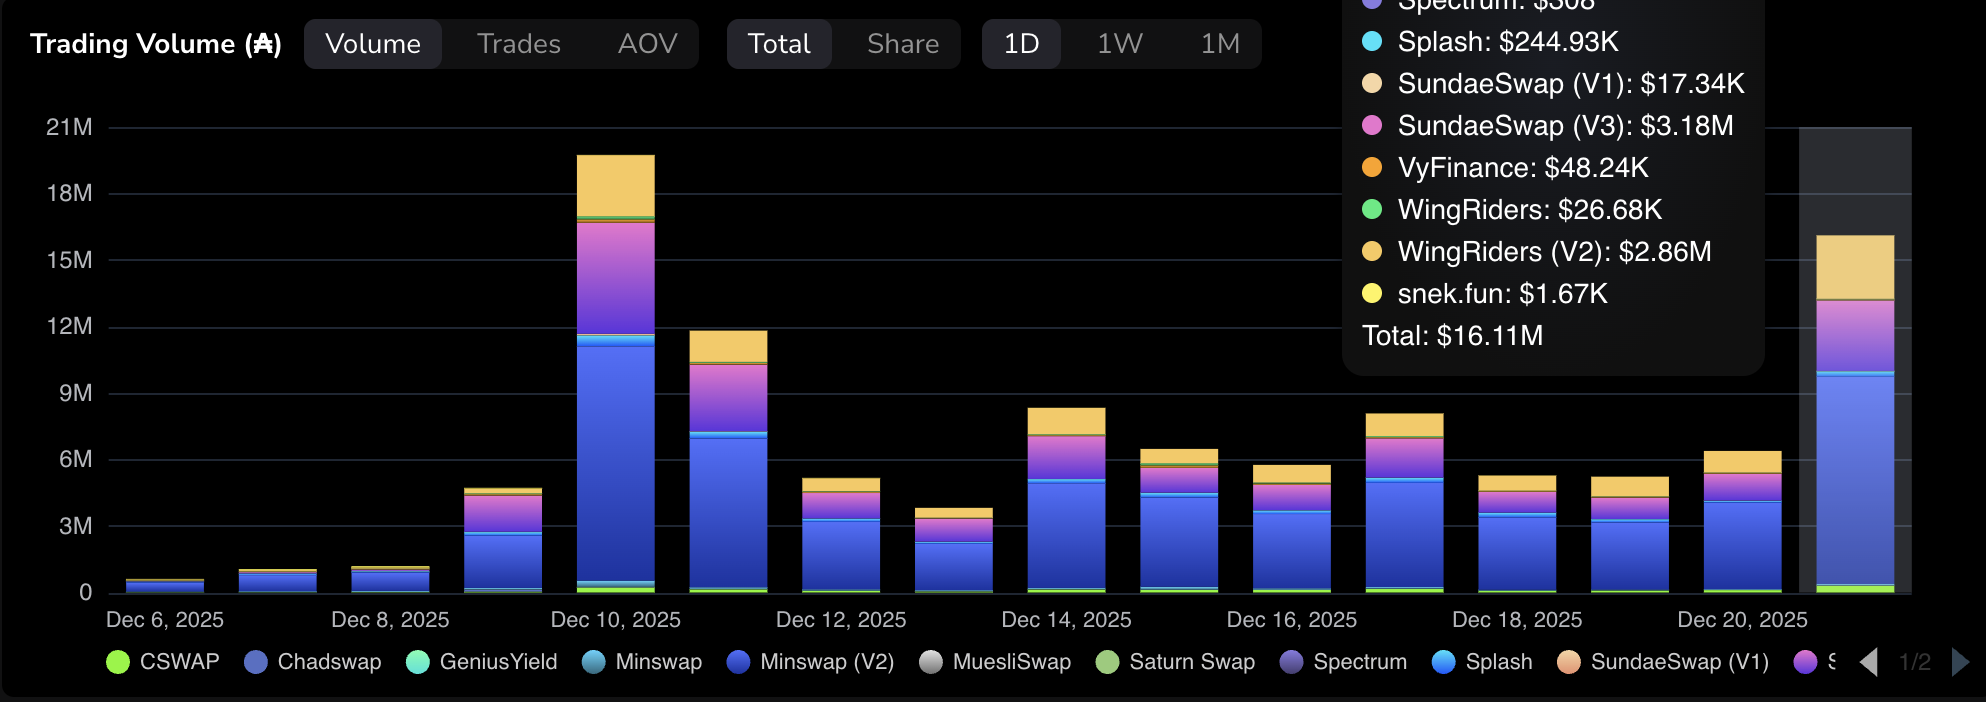
Cardano’s on-chain activity surged in December after the launch of its Midnight sidechain, peaking at $19.74 million on December 10. TapTools data shows that trading volume totaled $16.11 million on Sunday, up from $6.39 million the previous day.
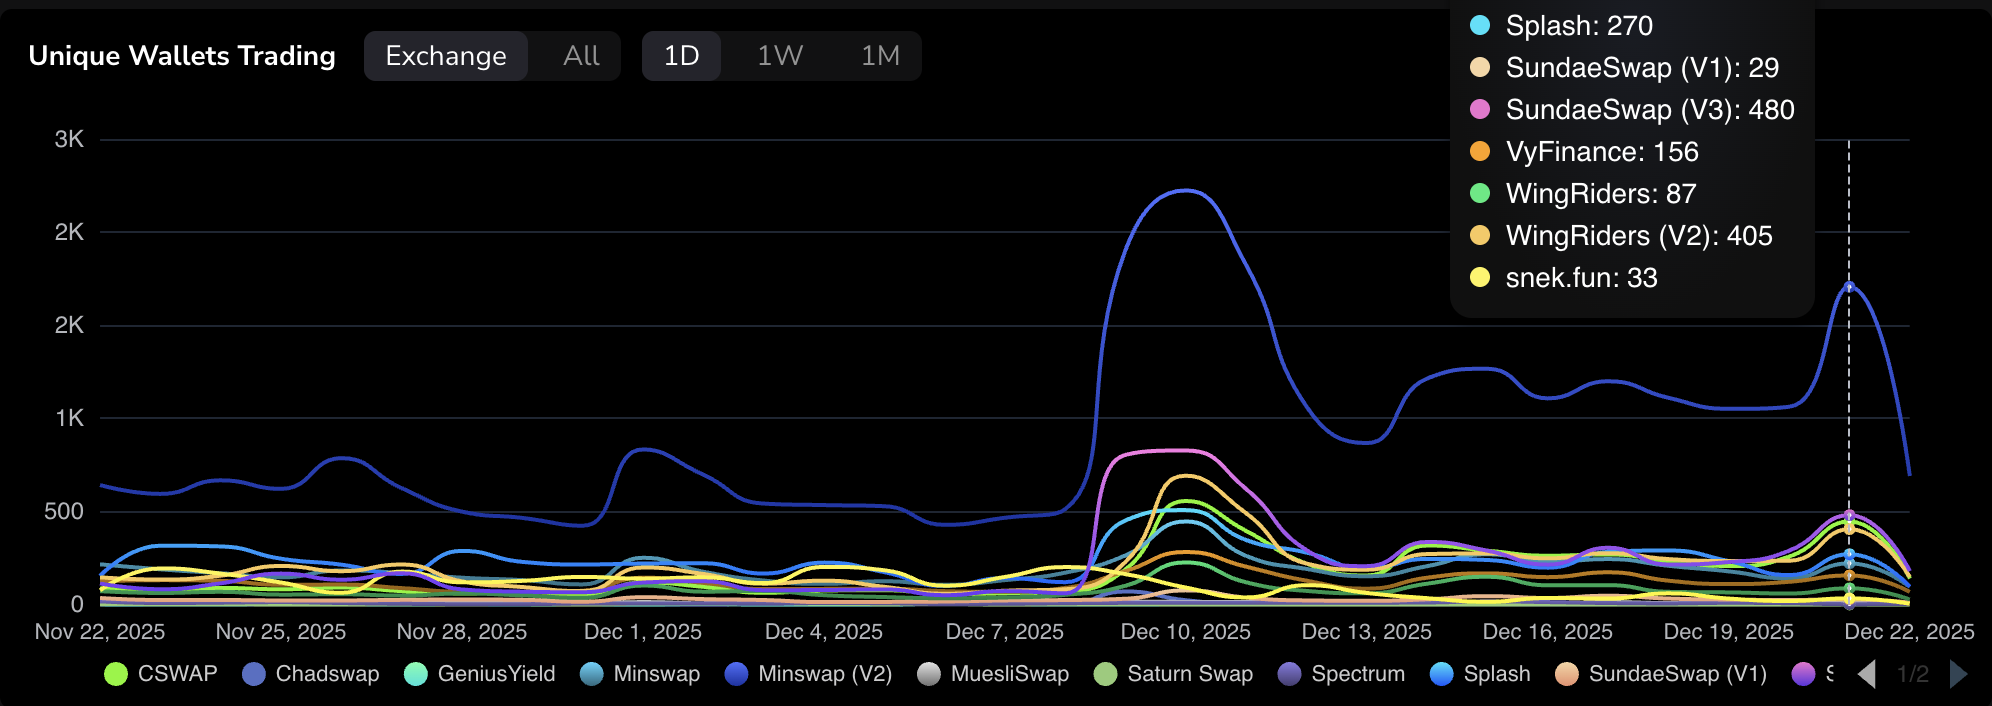
Similarly, the unique trading wallets reached a high of 3,150 in December and stood at 2,200 on Sunday.
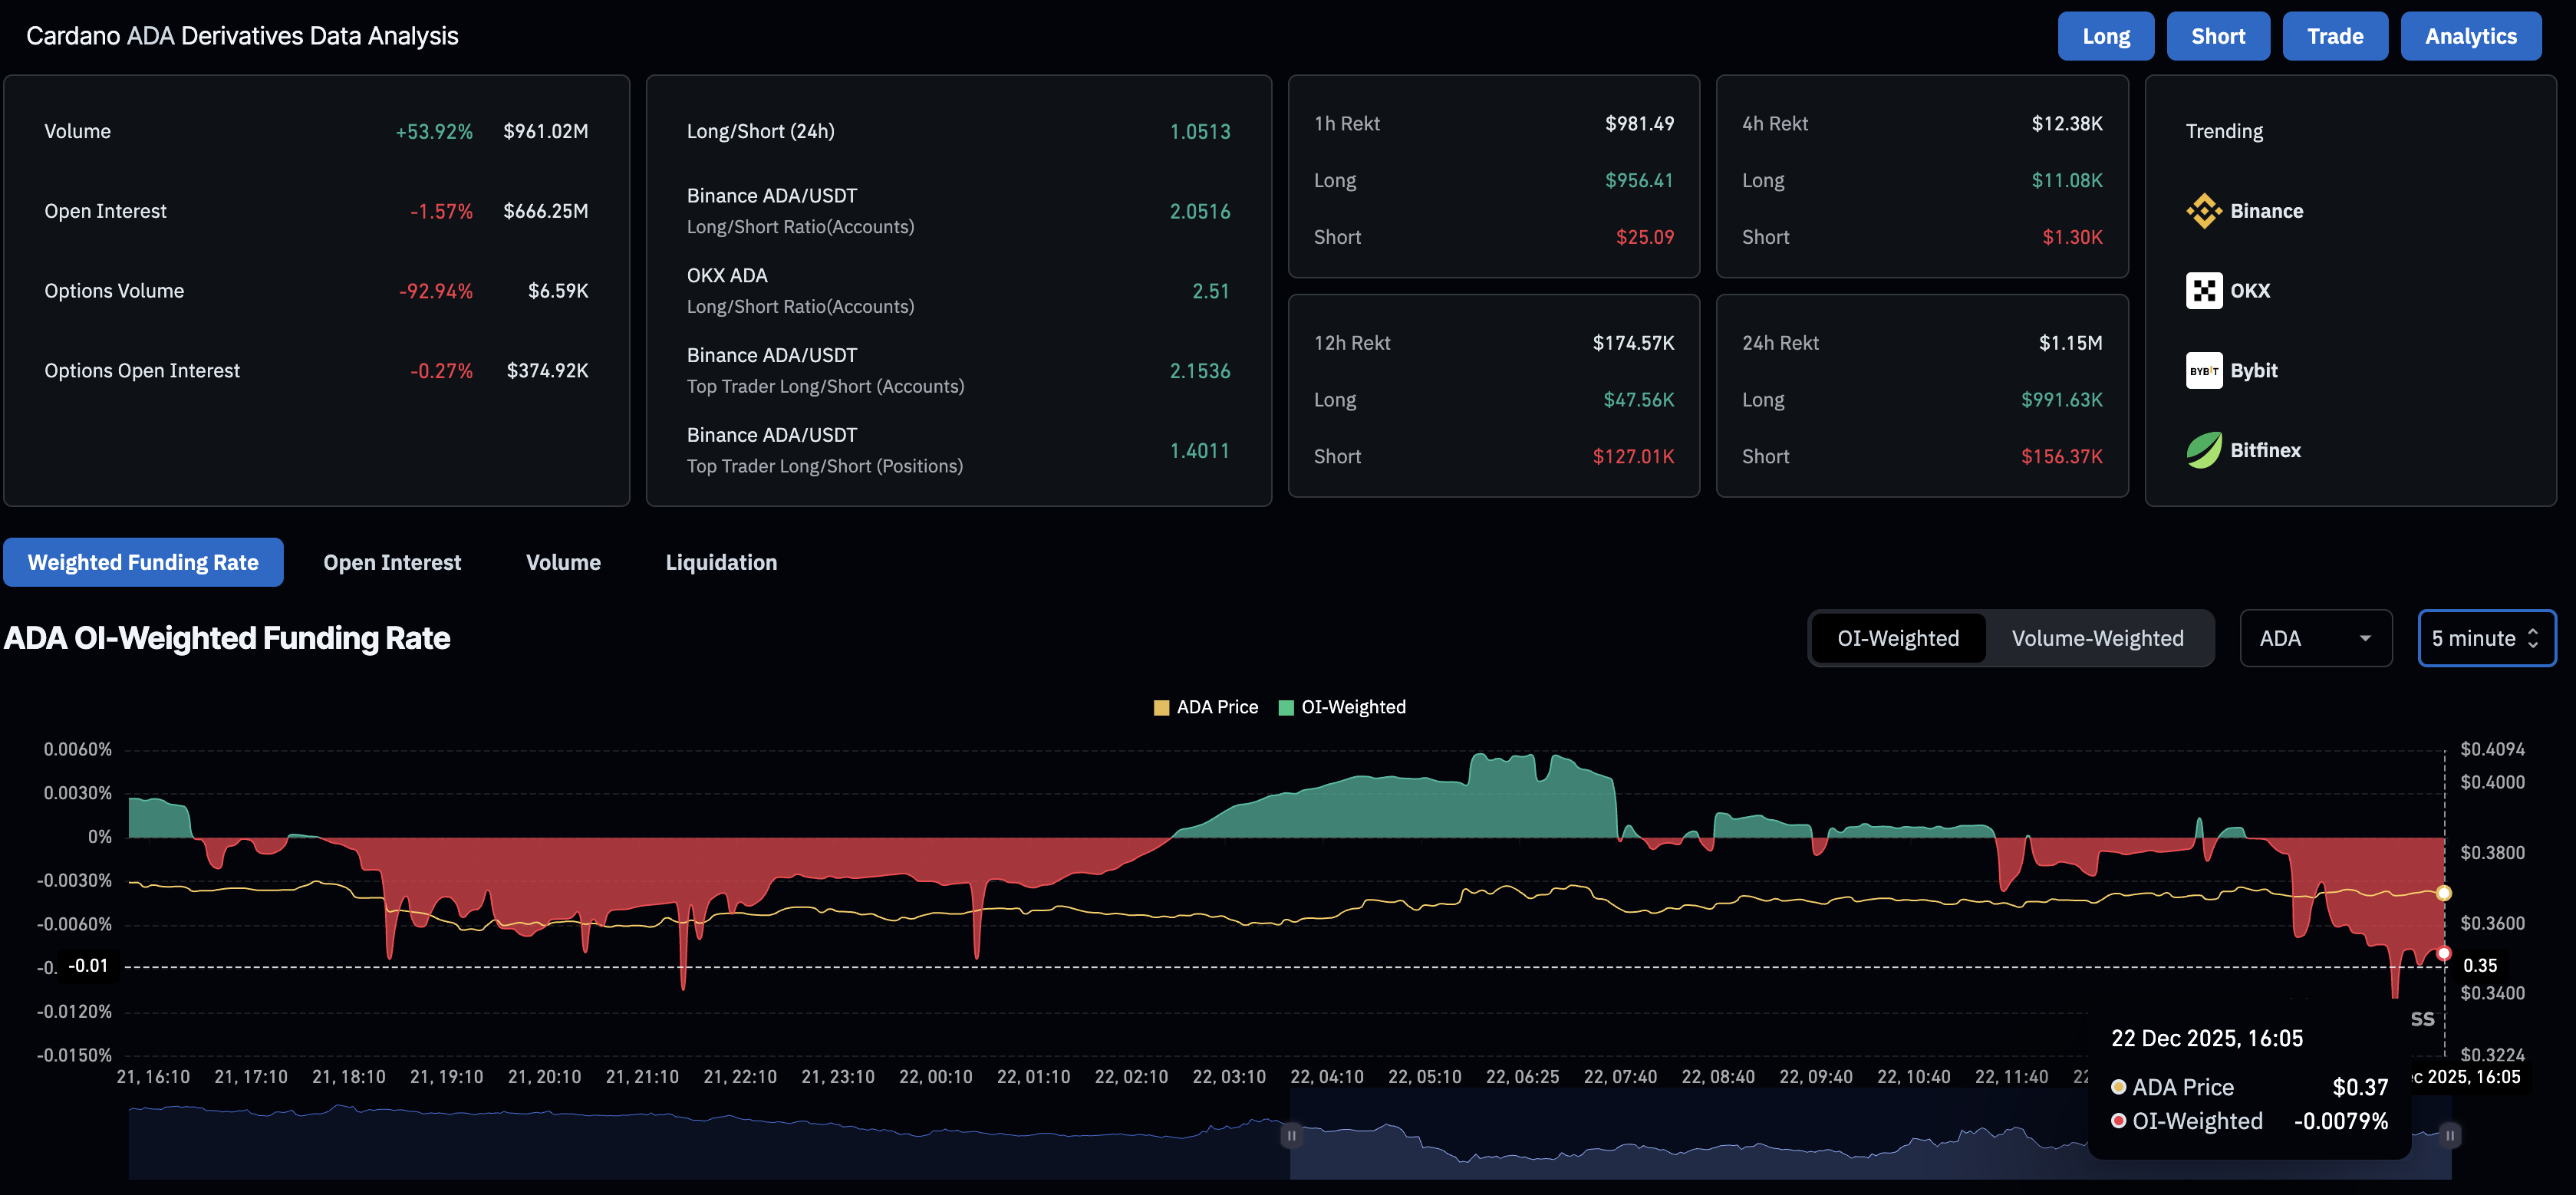
However, on the derivatives side, a risk-off sentiment among traders fuels the bearish interest. CoinGlass data shows a 1.57% decline in ADA futures Open Interest (OI) over the last 24 hours, to $666.25 million, suggesting traders are closing positions or reducing leverage.
Additionally, the OI-weighted funding rate is at -0.0079%, indicating that traders are paying a premium to hold bearish positions.
Cardano recovers in a falling wedge as selling pressure wanes
Cardano trades in a descending wedge pattern on the daily logarithmic chart formed by two converging trendlines. At the time of writing, ADA is up over 2% on Monday, recovering from two straight days of losses, and aims to extend the 7% gains from Friday.
A potential recovery in ADA could target the overhead trendline connecting the October 27 and December 9 highs, at $0.4350.
The technical indicators on the daily chart show a decline in selling pressure. The Relative Strength Index (RSI) at 38 reverses from the oversold zone, inching closer to the halfway line. Meanwhile, the Moving Average Convergence Divergence (MACD) approaches the signal line, suggesting a potential crossover that could signal a renewed bullish momentum.
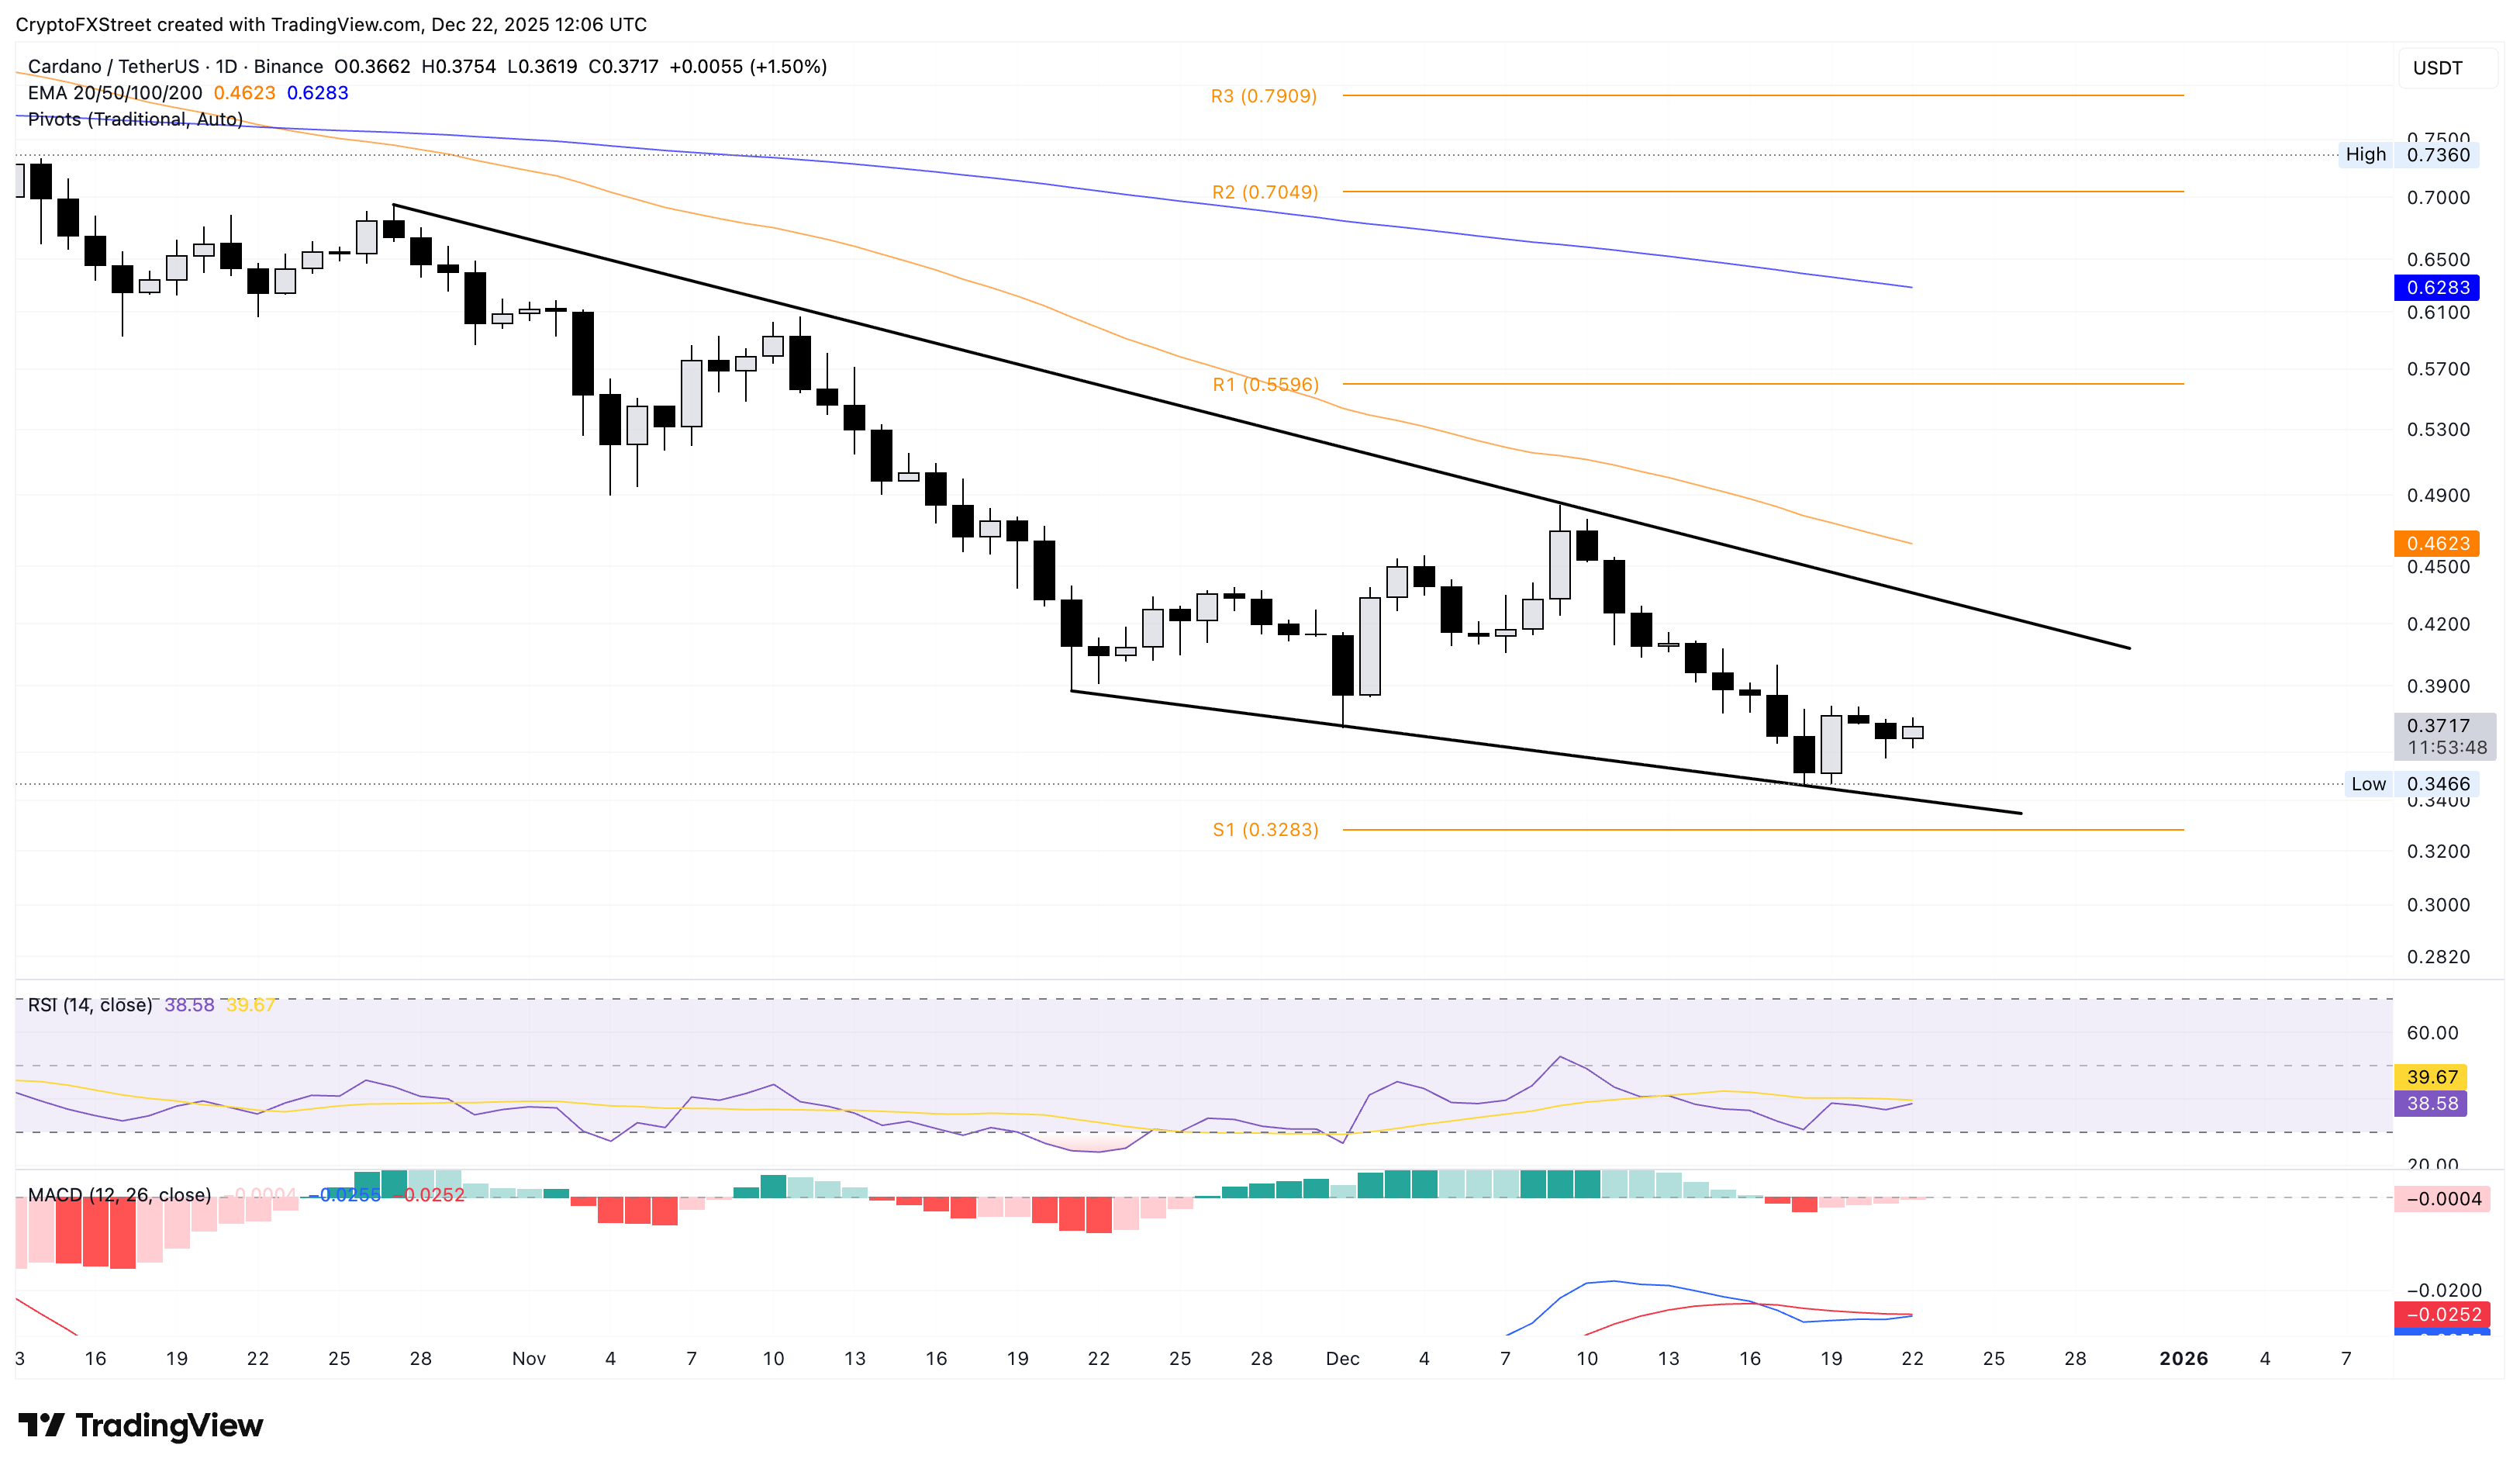
On the flip side, the lower trendline of the descending wedge pattern connecting the November 21 and December 1 lows, near $0.3415, could serve as immediate support.
Related Articles
Amazon Stock Predictions for 2026 to 2030: Will They Exceed Expectations and Achieve Major Long-Term Goals?
TradingKey - As we head into 2026, many investors are questioning where Amazon (AMZN) fits into the technology world.
A Crash After a Surge: Why Silver Lost 40% in a Week?
TradingKey - Spot silver (XAGUSD) prices continue to decline. Silver plunged 20% on Thursday, breaking below $71 per ounce, with the sell-off intensifying on Friday as prices fell further below $64. Compared to the all-time high set on January 29, silver prices have retraced more than 40%, wiping out nearly all gains accumulated over the previous month.
Is Bitcoin’s Four-Year Cycle Dead in 2026?
Is the Bitcoin 4-year cycle dead? After 2025 broke historical records with a red post-halving year, institutional analysts explore if the Bitcoin price has decoupled from the halving countdown. Analyze the impact of spot ETFs, global liquidity, and the roadmap to the 2028 halving in this 2026 market
USD Dollar Trend Forecast: Dollar Index Falls Below 97.0 to 4-Year Low, Will the Dollar Continue To Fall or Bottom Out in 2026?
TradingKey - In January 2026, the US Dollar Index continued its downward trend from 2025, officially breaking below the key 97.0 level and reaching a low of 95.5, marking a nearly four-year low since February 2022.

