

Crypto Today: Bitcoin, Ethereum, XRP rebound amid bearish market conditions

- Bitcoin edges up above $87,000 as investors react to US inflation rising slower than expected in November.
- Ethereum regains momentum as buyers tighten their grip, targeting a breakout above $3,000.
- XRP gains 3% on Friday, supported by increasing inflows into US-listed spot ETFs.
Bitcoin (BTC) is edging higher, trading above $88,000 at the time of writing on Monday. Altcoins, including Ethereum (ETH) and Ripple (XRP), are following in BTC’s footsteps, experiencing relief rebounds following a volatile week.
Ethereum holds above $2,900 as bulls target a short-term breakout above $3,000. Meanwhile, XRP is steady above support at $1.82, supported by inflows into spot Exchange Traded Funds (ETFs).
Data spotlight: BTC, ETH, XRP show strength amid softer US inflation
The United States (US) Consumer Price Index (CPI) data released by the Bureau of Labor Statistics (BLS) on Thursday showed that annual inflation increased by 2.7% in November, trailing the market expectation of 3.1%.
During this period, the core CPI, which excludes the volatile prices of food and energy, increased by 2.6%, below analysts’ estimates of a 3% increase.
Following the release of the CPI report, cryptocurrency prices edged higher, reflecting investor enthusiasm, especially after the Federal Reserve (Fed) tempered expectations of aggressive rate cutting in 2026 after the December monetary decision, in which the central bank reduced interest rates by 25 basis points to a range of 3.50%-3.75%.
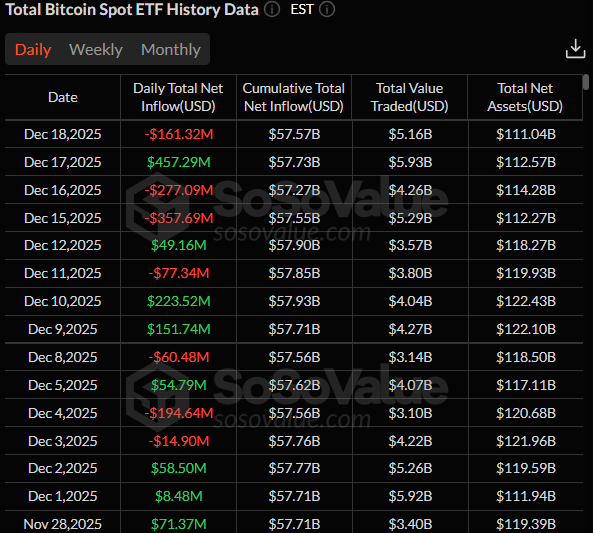
It is not clear whether the rebound will continue into the New Year, especially after Bitcoin spot ETFs recorded outflows of approximately $161 million on Thursday.
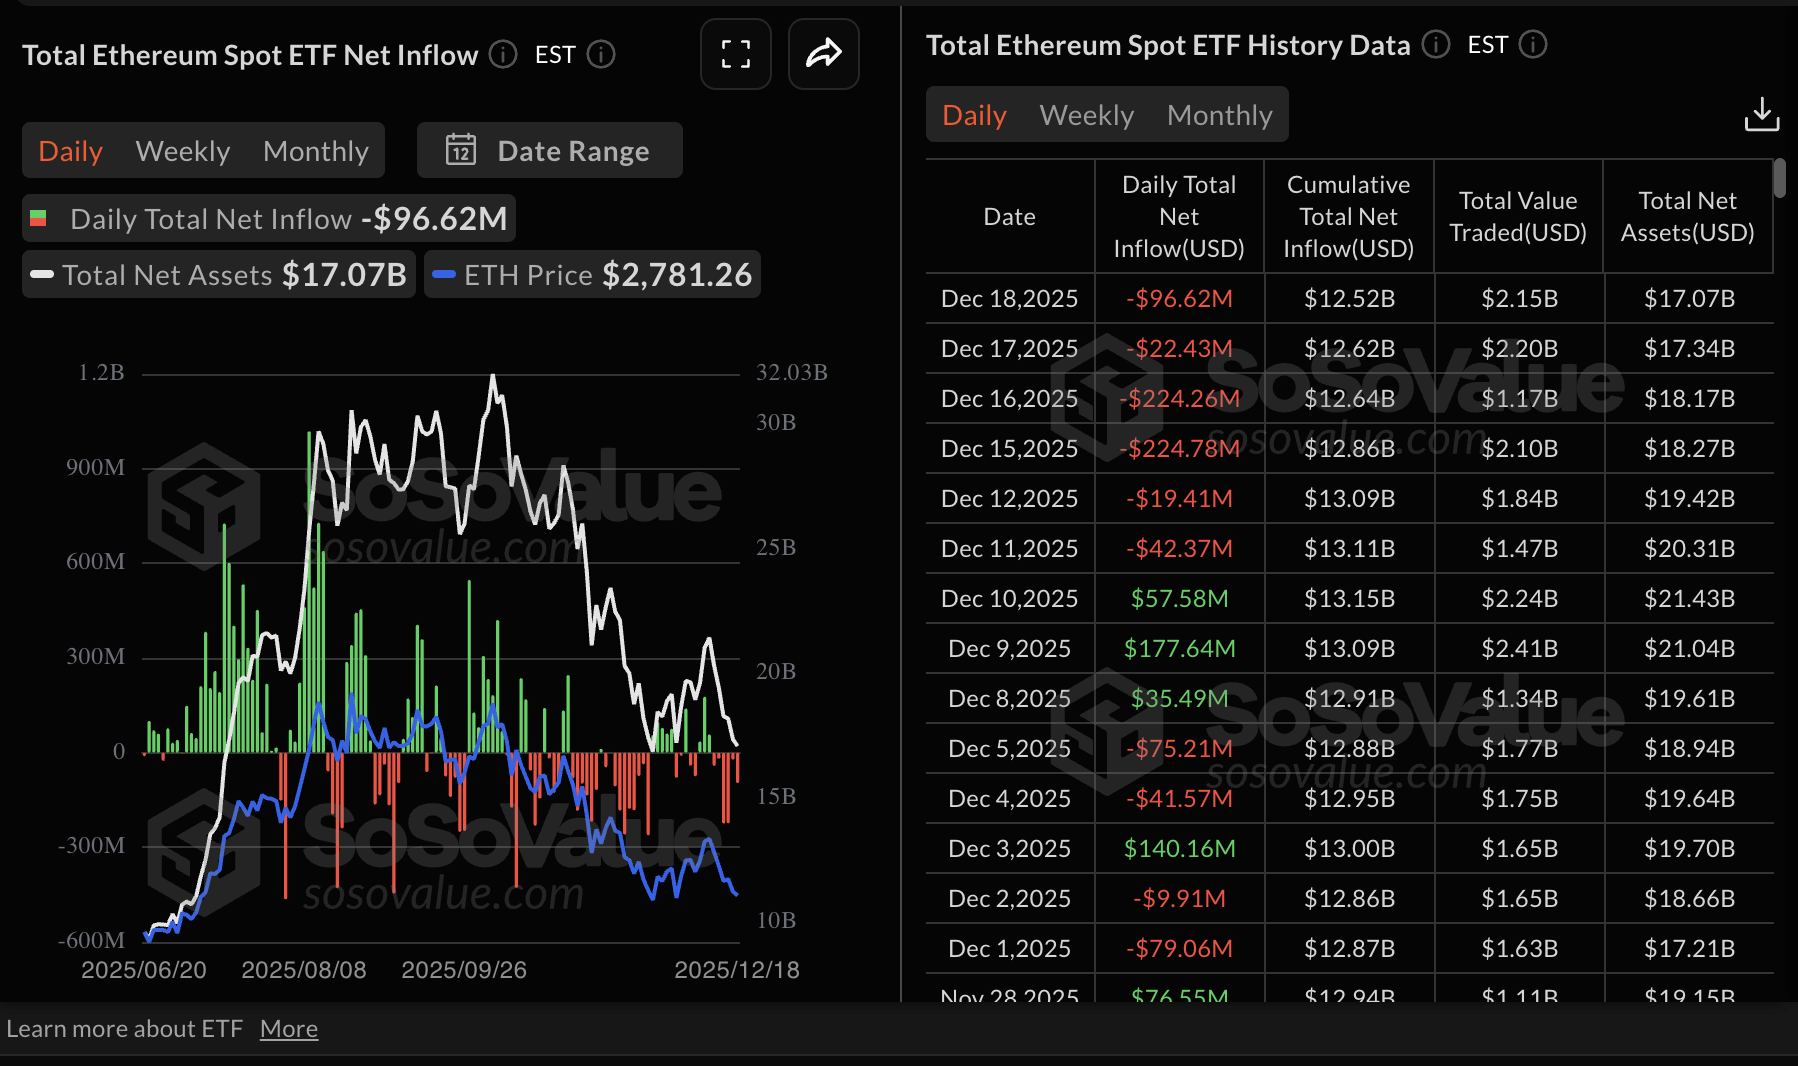
Ethereum ETFs also posted outflows of nearly $97 million on Thursday. Ethereum has maintained six days of consecutive outflows, reflecting the overall bearish sentiment in the broader cryptocurrency market. The cumulative net inflow stands at $12.52 billion with net assets at $17.07 billion.
XRP spot ETFs, on the other hand, continue to defy the odds by posting steady positive flows. The daily inflow amounted to approximately $30 million on Thursday. XRP ETFs’ cumulative inflow volume stands at $1.06 billion, with net assets averaging $1.14 billion.
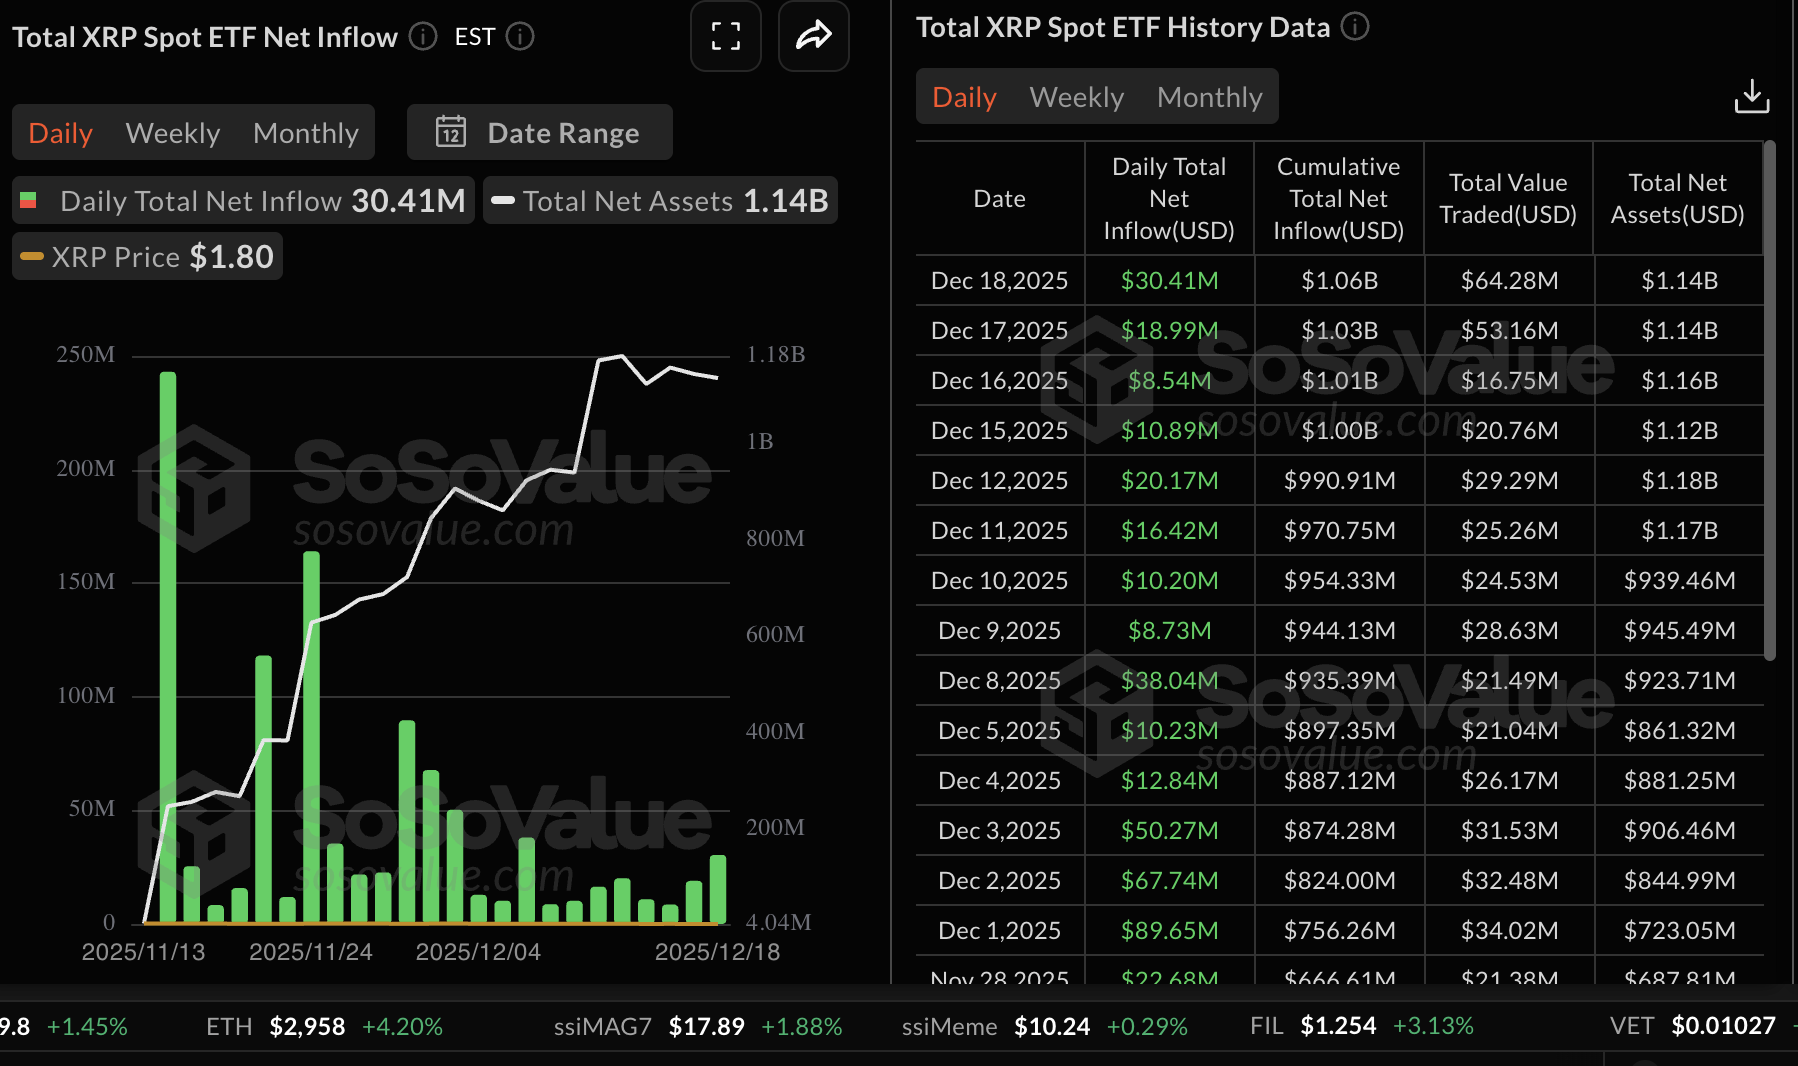
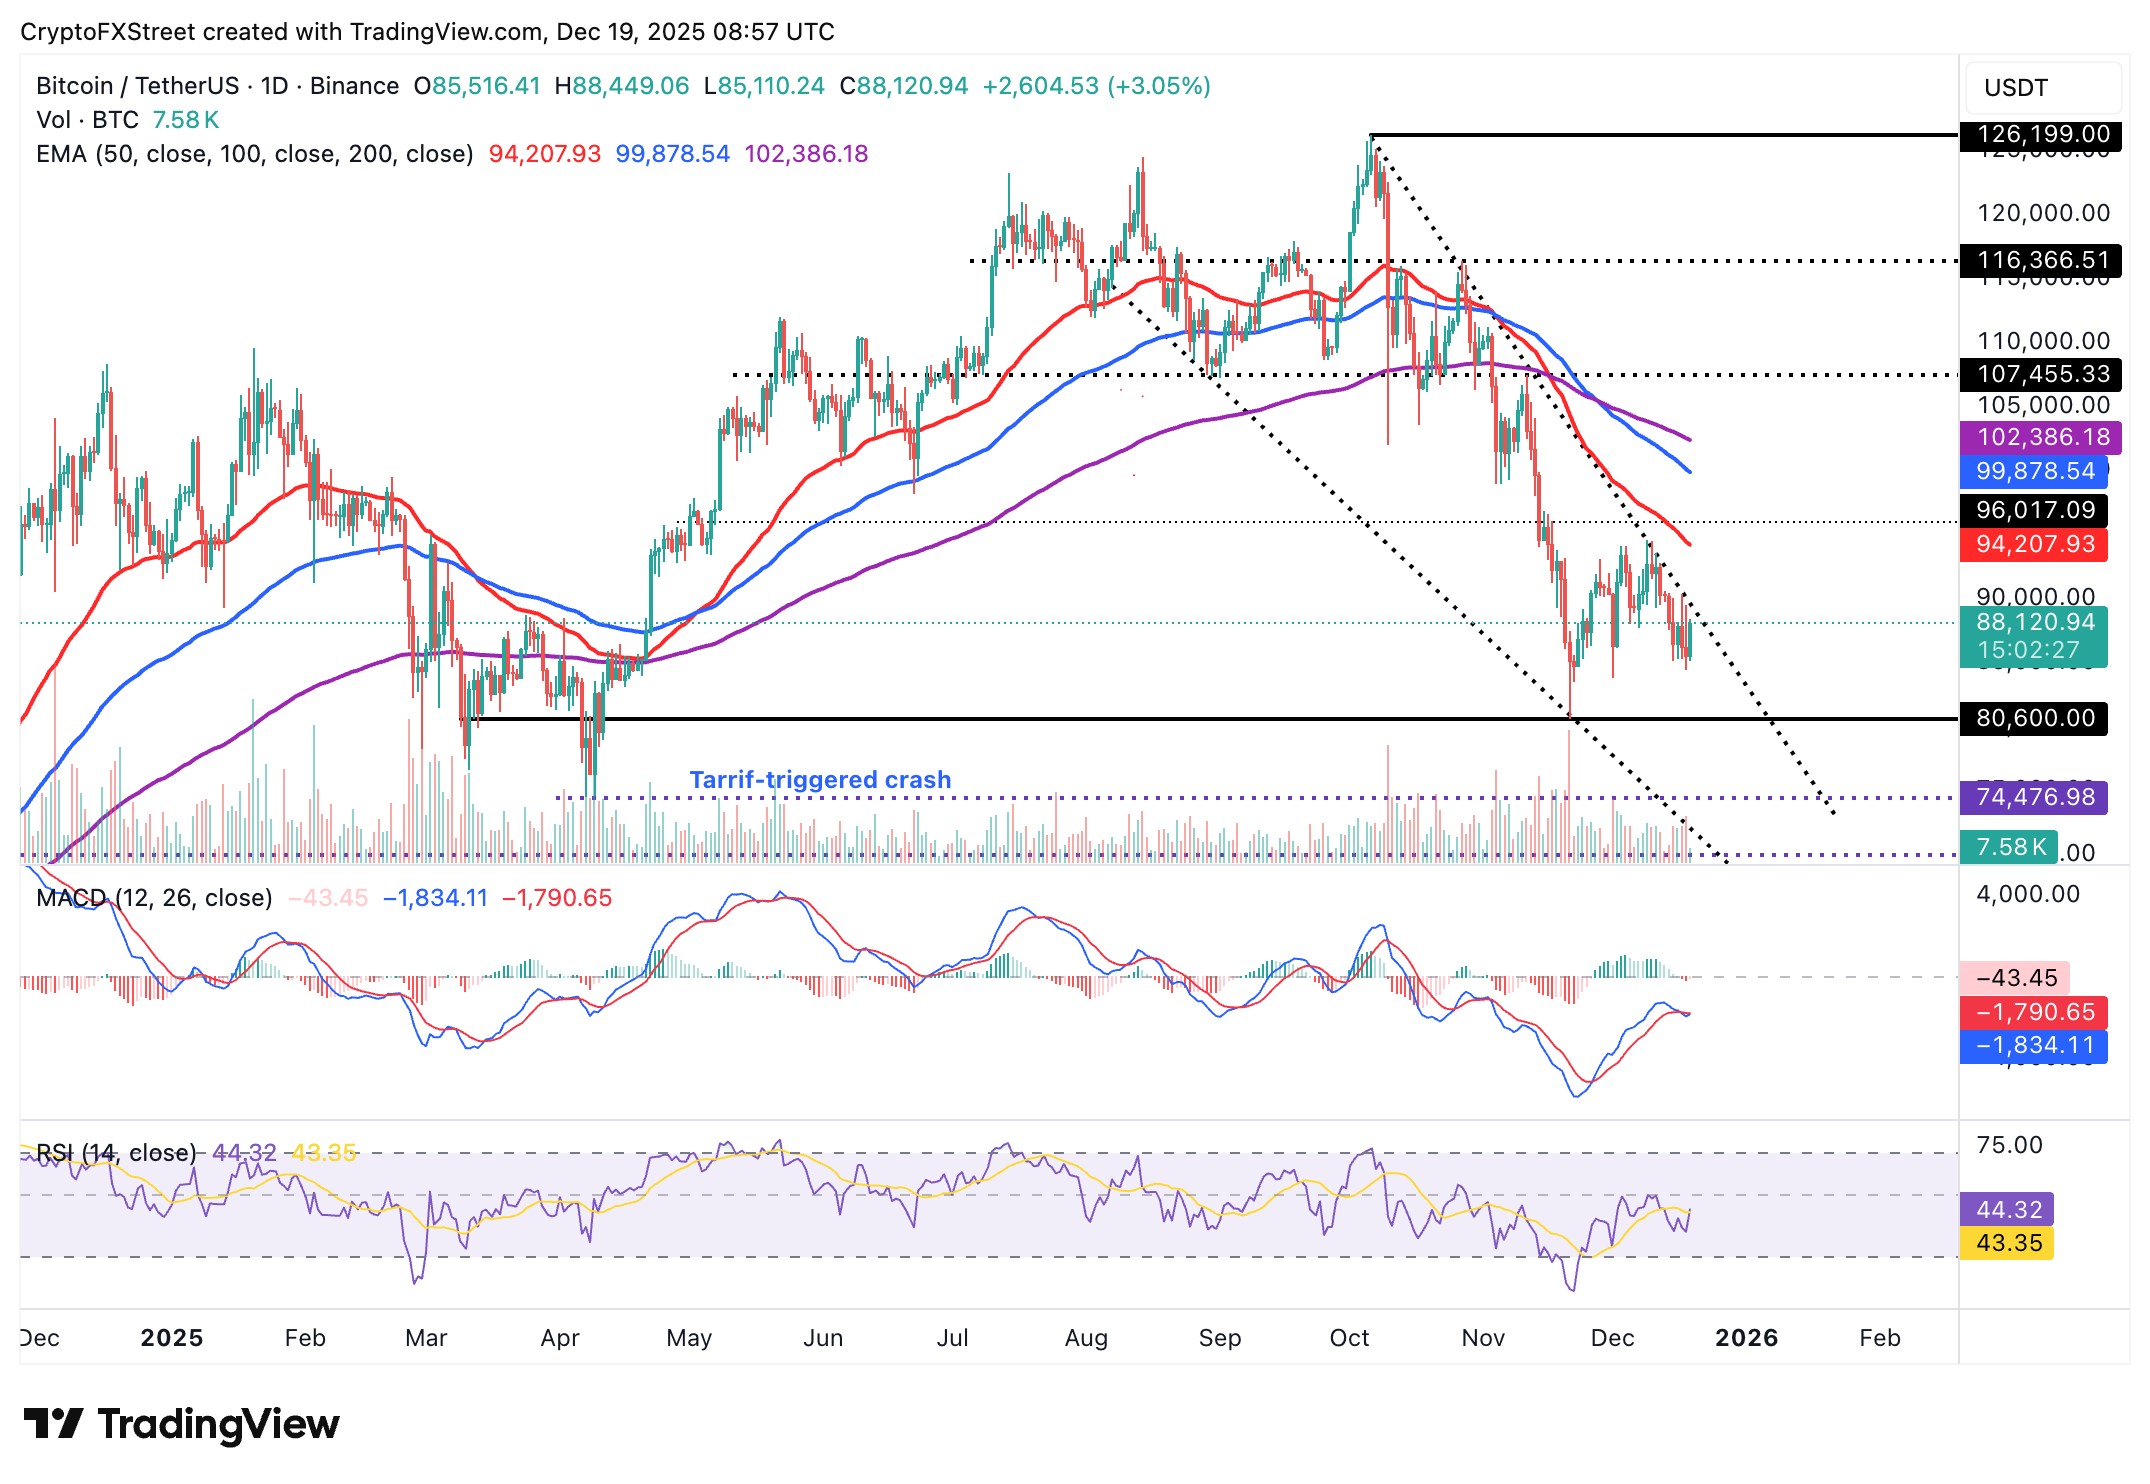
Chart of the day: Bitcoin eyes short-term breakout as downside risks linger
Bitcoin price is trading marginally above $88,000 at the time of writing on Friday, as bulls target a breakout above a descending trendline on the daily chart.
The Relative Strength Index (RSI) on the same chart has risen to 44, indicating that bearish momentum is easing. Further increases above the 50 midline would support a return of bullish momentum and increase the odds of Bitcoin rising toward $100,000.
Traders will watch out for a buy signal from the Moving Average Convergence Divergence (MACD) indicator on the daily chart, which would occur with the blue line crossing above the red signal line. For now, the MACD remains in the bearish region, suggesting that Bitcoin is not out of the woods yet.
Furthermore, Bitcoin is trading below the downward-trending 50-day Exponential Moving Average (EMA) at $94,207, the 100-day EMA at $99,878 and the 200-day EMA at $102,386, which emphasize the prevailing bearish conditions. A close above the descending trendline and the 50-day EMA would reinforce the bullish grip and increase the chances of a sustainable recovery, targeting the dynamic resistance of the 50-day EMA and the 100-day EMA.
Altcoins update: Ethereum, XRP show subtle recovery signs
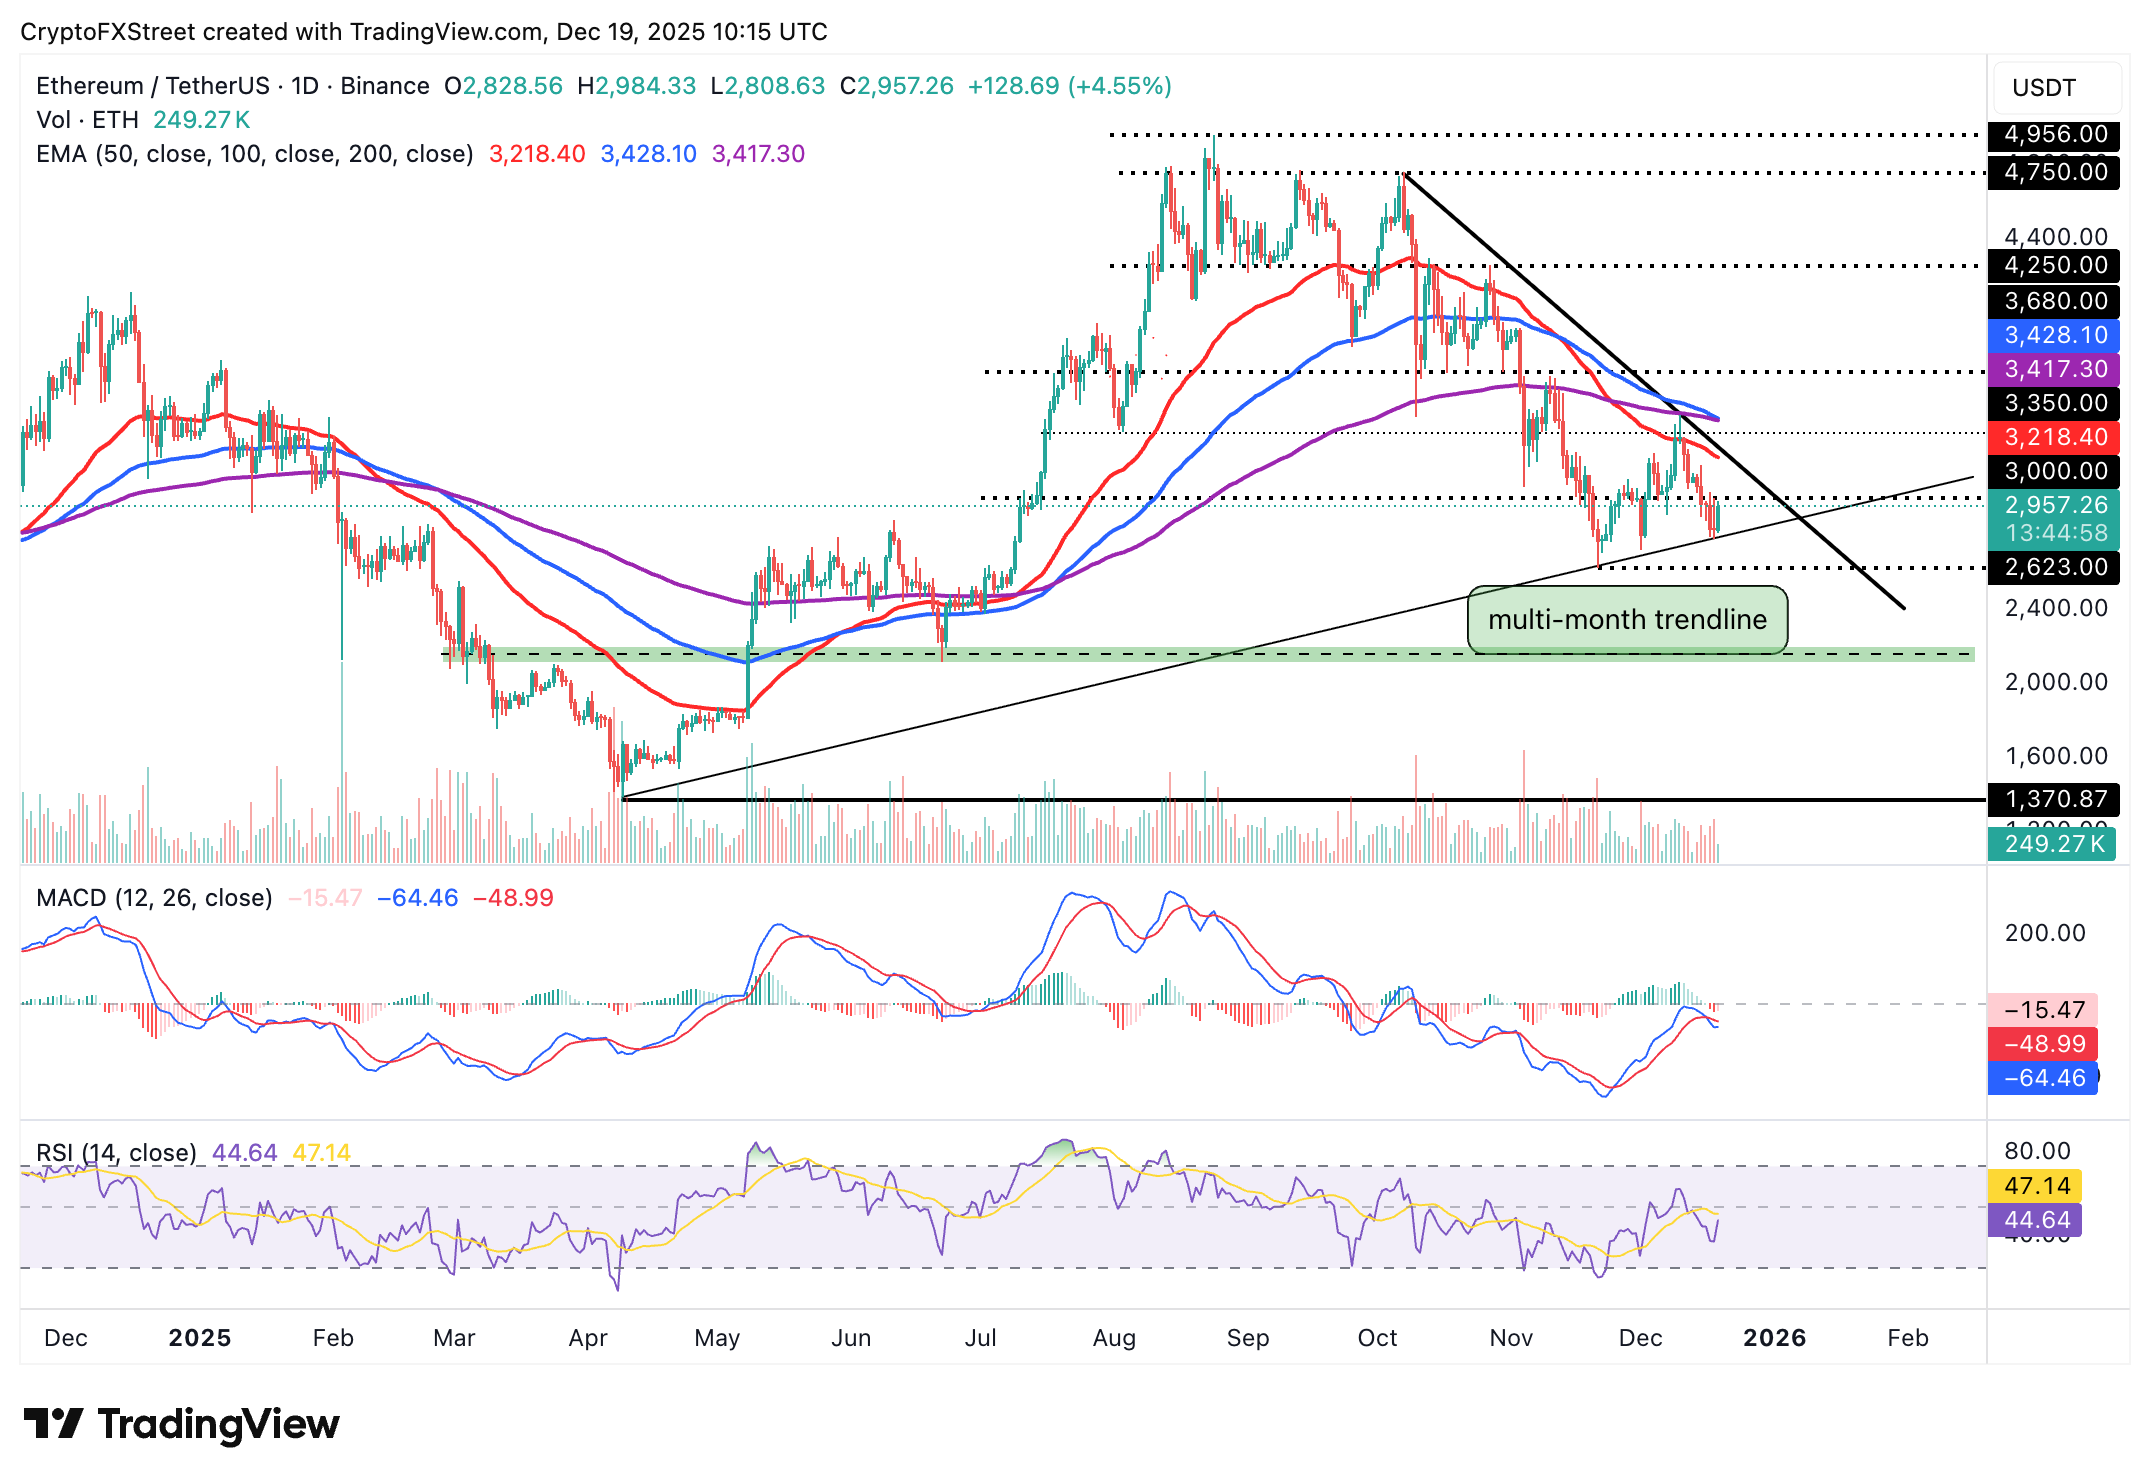
Ethereum is trading above $2,900 at the time of writing on Friday, supported by an uptrending RSI, holding at 44 on the daily chart. If the RSI climbs further above the 50 midline, the path with the least resistance will remain upward, increasing the odds of ETH climbing above the pivotal $3,000 level.
A daily close above $3,000 would affirm the short-term bullish outlook. However, the MACD indicator on the same daily chart still holds a sell signal, which could limit the recovery if investors reduce their exposure or stay on the sidelines.
Ethereum also sits below the 50-day EMA at $3,218, the 200-day EMA at $3,417, and the 100-day EMA at $3,428, all of which slope downward and reinforce the overall bearish outlook.
Another close below $3,000 could destabilize Ethereum further and exert more pressure on the ascending trendline support. Breaking below this trend line may accelerate the downtrend toward November’s low of $2,623.
XRP is trading at $1.86 at the time of writing on Friday while holding below the 50-day EMA at $2.15, the 100-day EMA at $2.34 and the 200-day EMA at $2.42, all of which keep the cross-border remittance token under layered dynamic resistance. Despite XRP's 3% intraday increase, this bearish alignment preserves the broader downtrend.
The MACD red histogram bars remain below the mean line on the daily chart , while the blue line sits under the red signal line, reinforcing the bearish thesis. Meanwhile, the RSI prints 37 within bearish region on the same chart, but is edging higher, hinting at tentative stabilization and a potential rebound toward $2.00.
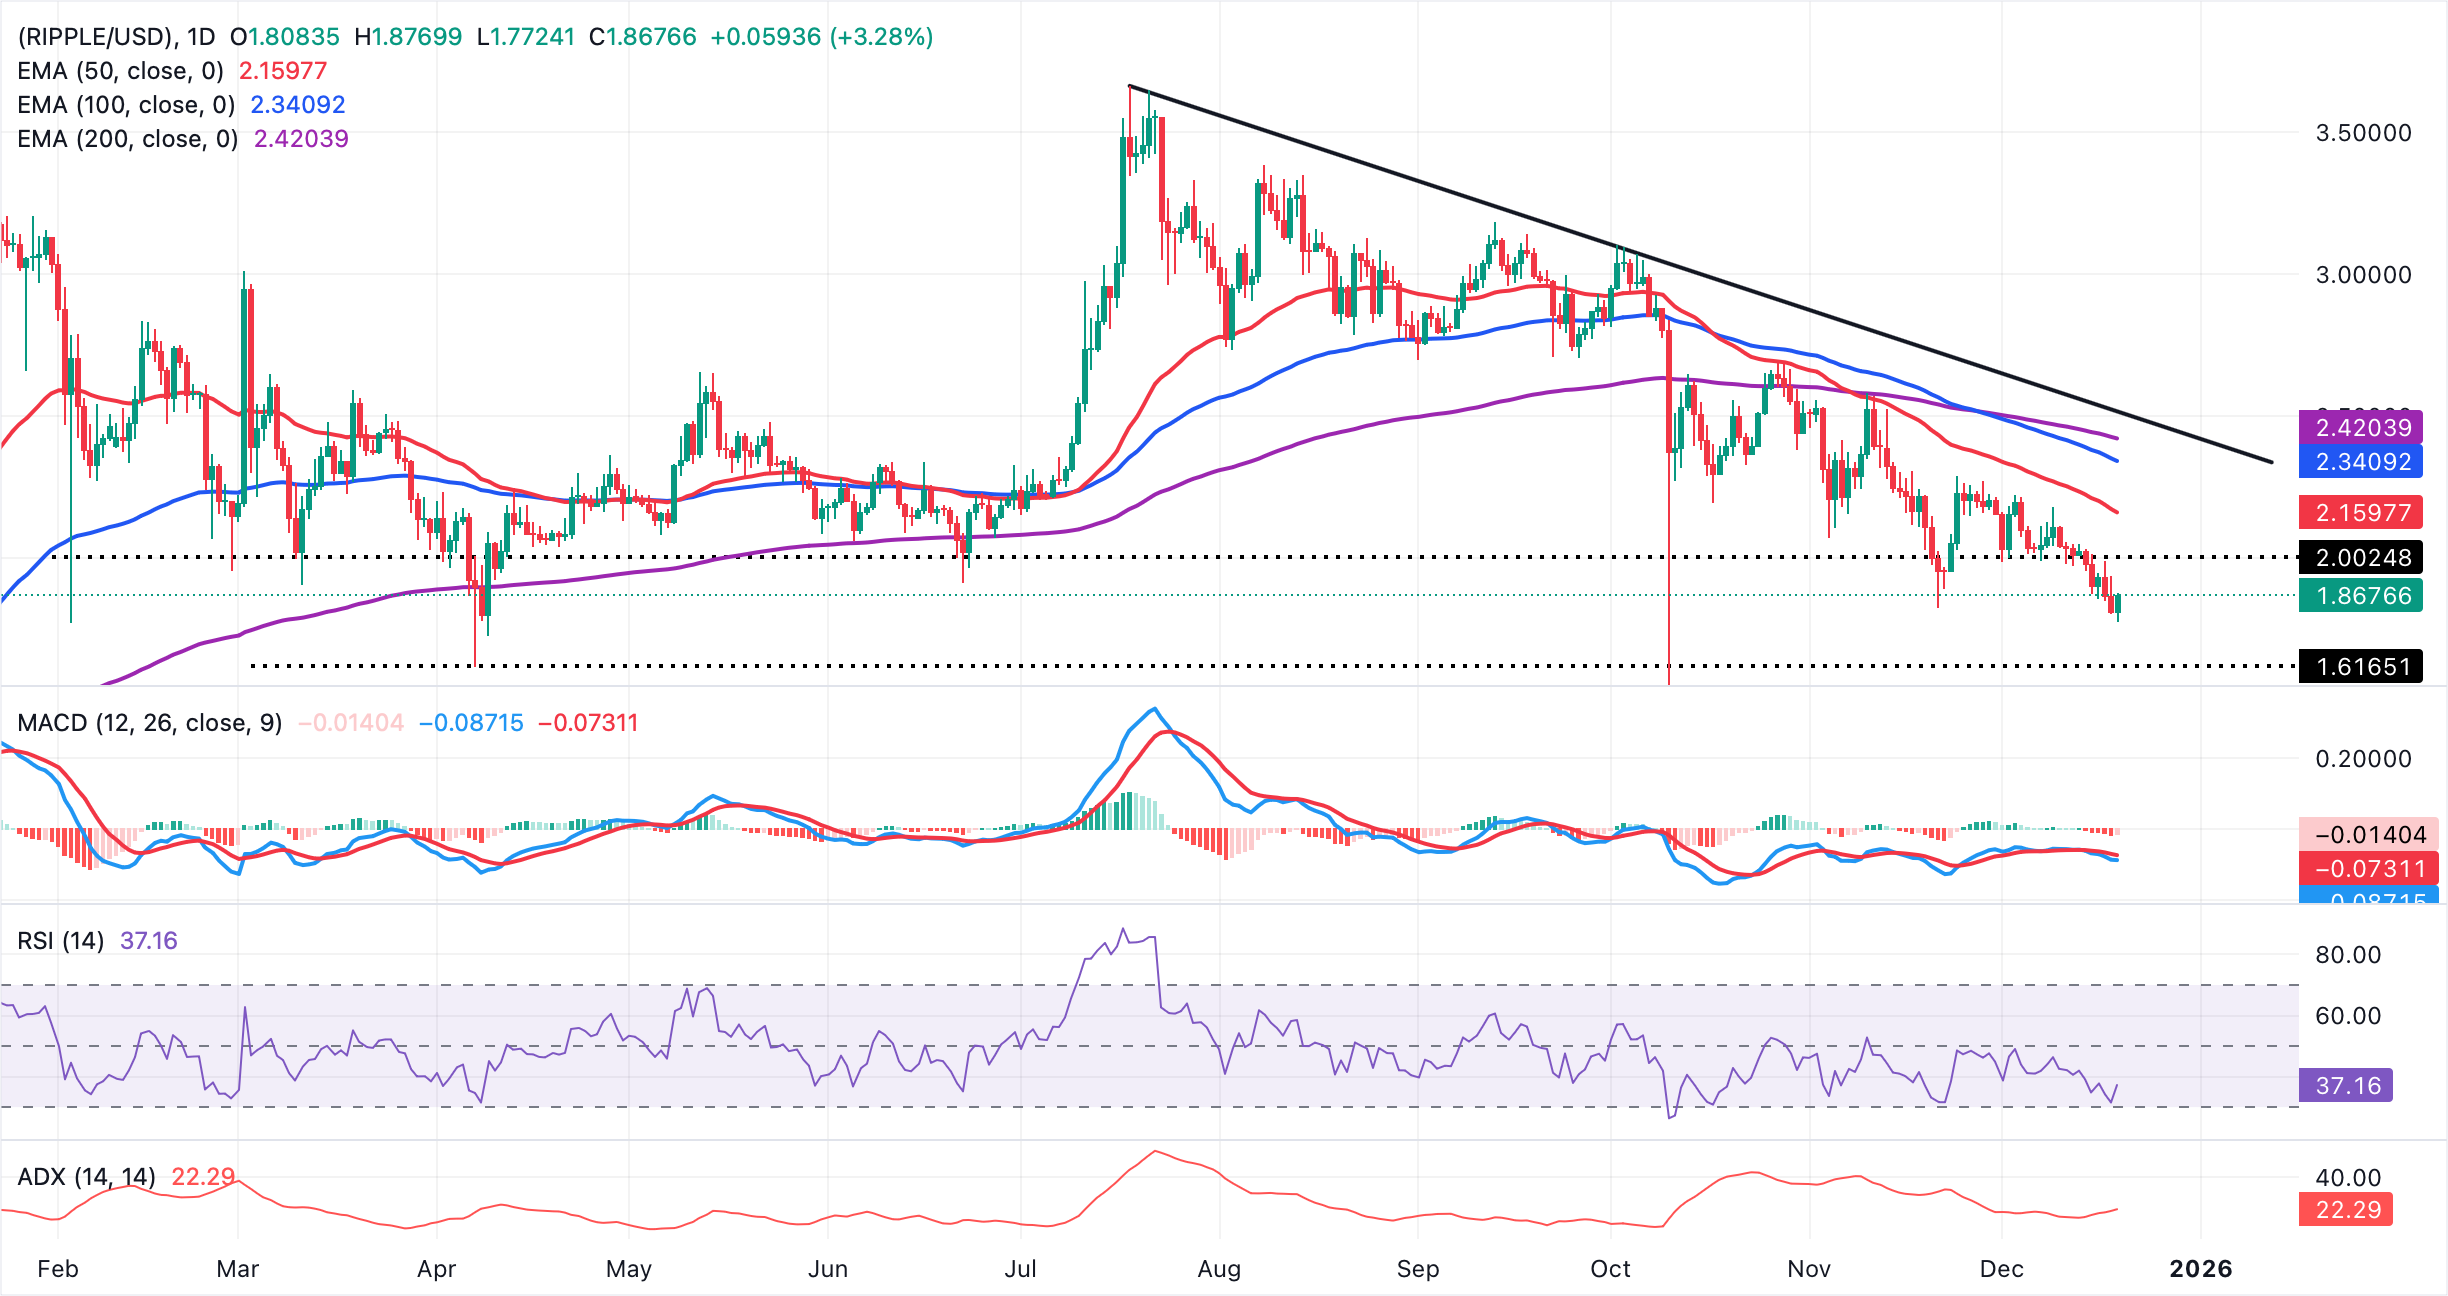
The descending trend line from $3.66 limits rebounds, with resistance seen at $2.51. The Average Directional Index (ADX) has a firm base at 22, pointing to modest but building trend strength. A daily close above $2.51would be needed to break the bearish structure and open the door to a corrective recovery, whereas failure to clear it would keep the path of least resistance to the downside.
Crypto ETF FAQs
An Exchange-Traded Fund (ETF) is an investment vehicle or an index that tracks the price of an underlying asset. ETFs can not only track a single asset, but a group of assets and sectors. For example, a Bitcoin ETF tracks Bitcoin’s price. ETF is a tool used by investors to gain exposure to a certain asset.
Yes. The first Bitcoin futures ETF in the US was approved by the US Securities & Exchange Commission in October 2021. A total of seven Bitcoin futures ETFs have been approved, with more than 20 still waiting for the regulator’s permission. The SEC says that the cryptocurrency industry is new and subject to manipulation, which is why it has been delaying crypto-related futures ETFs for the last few years.
Yes. The SEC approved in January 2024 the listing and trading of several Bitcoin spot Exchange-Traded Funds, opening the door to institutional capital and mainstream investors to trade the main crypto currency. The decision was hailed by the industry as a game changer.
The main advantage of crypto ETFs is the possibility of gaining exposure to a cryptocurrency without ownership, reducing the risk and cost of holding the asset. Other pros are a lower learning curve and higher security for investors since ETFs take charge of securing the underlying asset holdings. As for the main drawbacks, the main one is that as an investor you can’t have direct ownership of the asset, or, as they say in crypto, “not your keys, not your coins.” Other disadvantages are higher costs associated with holding crypto since ETFs charge fees for active management. Finally, even though investing in ETFs reduces the risk of holding an asset, price swings in the underlying cryptocurrency are likely to be reflected in the investment vehicle too.
(The technical analysis of this story was written with the help of an AI tool)
Related Articles
Amazon Stock Predictions for 2026 to 2030: Will They Exceed Expectations and Achieve Major Long-Term Goals?
TradingKey - As we head into 2026, many investors are questioning where Amazon (AMZN) fits into the technology world.
A Crash After a Surge: Why Silver Lost 40% in a Week?
TradingKey - Spot silver (XAGUSD) prices continue to decline. Silver plunged 20% on Thursday, breaking below $71 per ounce, with the sell-off intensifying on Friday as prices fell further below $64. Compared to the all-time high set on January 29, silver prices have retraced more than 40%, wiping out nearly all gains accumulated over the previous month.
Is Bitcoin’s Four-Year Cycle Dead in 2026?
Is the Bitcoin 4-year cycle dead? After 2025 broke historical records with a red post-halving year, institutional analysts explore if the Bitcoin price has decoupled from the halving countdown. Analyze the impact of spot ETFs, global liquidity, and the roadmap to the 2028 halving in this 2026 market
USD Dollar Trend Forecast: Dollar Index Falls Below 97.0 to 4-Year Low, Will the Dollar Continue To Fall or Bottom Out in 2026?
TradingKey - In January 2026, the US Dollar Index continued its downward trend from 2025, officially breaking below the key 97.0 level and reaching a low of 95.5, marking a nearly four-year low since February 2022.

