

Dogecoin Price Forecast: DOGE at key support flashes mixed technical signals

- Dogecoin is up almost 2% on Monday from the $0.1332 support level of a consolidation range, a potential rebound is likely.
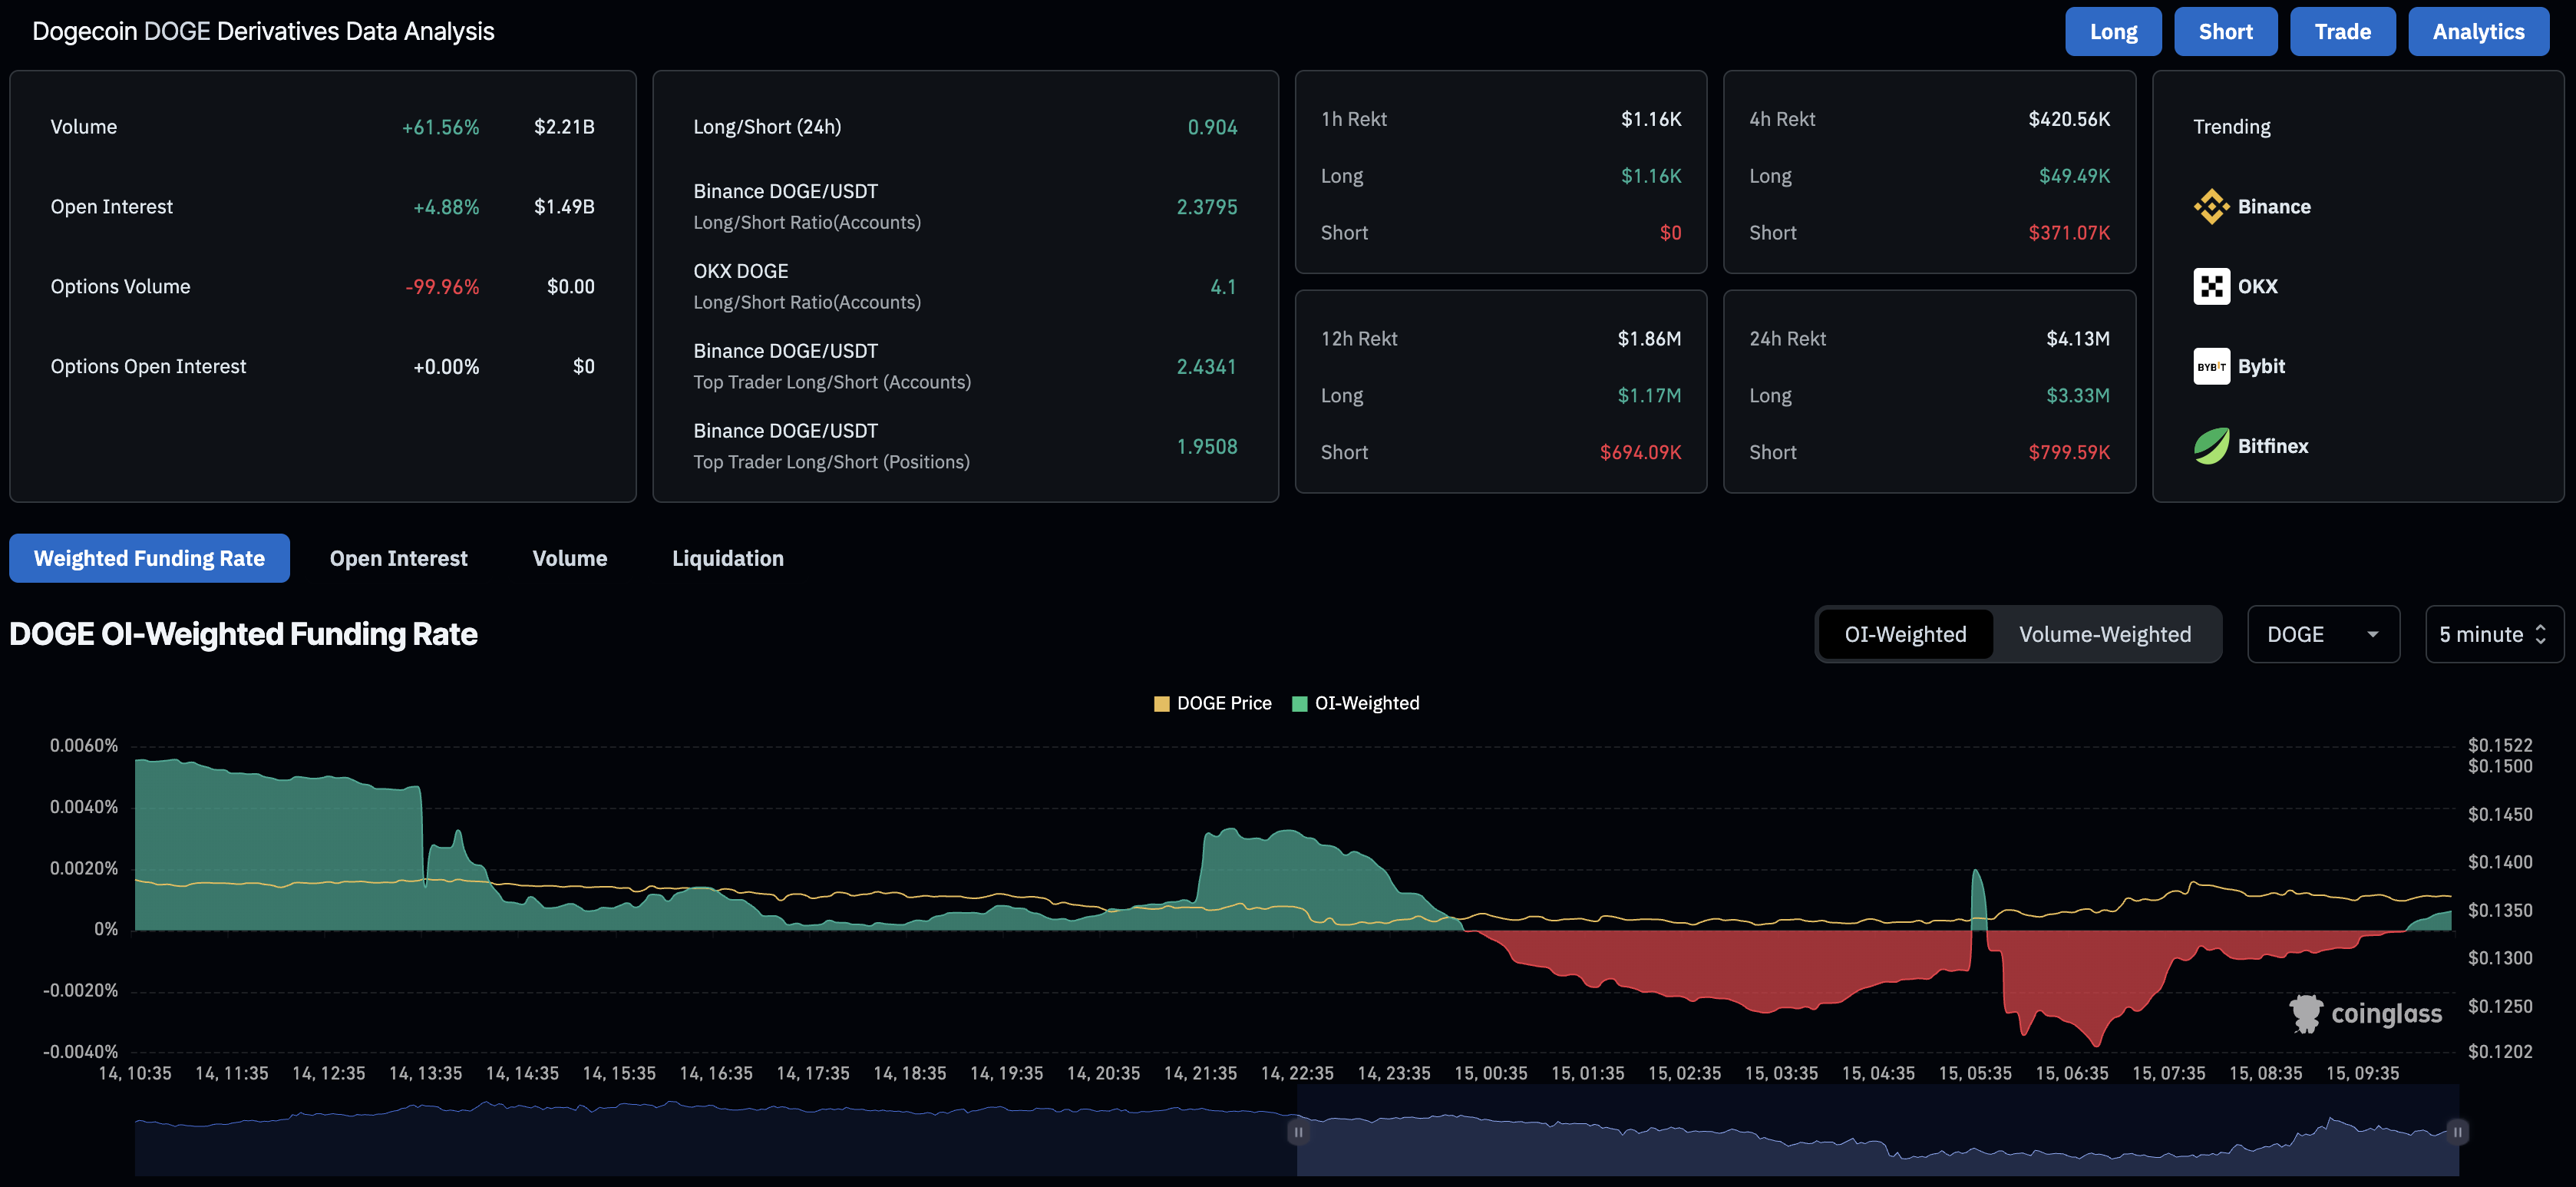
- Derivatives data show an increase in bullish bets and Open Interest, indicating renewed risk-on sentiment.
- The technical outlook for DOGE remains mixed, as the MACD indicator signals a potential bearish crossover.
Dogecoin (DOGE) edges higher by nearly 2% at press time on Monday, recovering from a 3.57% loss on the previous day. The meme coin risks falling out of a consolidation range amid weak institutional demand and declining bullish momentum. However, the derivatives market sees a surge in bullish bets as traders anticipate a potential rebound, increasing the capital exposure in DOGE futures.
Retail demand strengthens for DOGE, overlooking long liquidations
CoinGlass data shows that the Dogecoin futures Open Interest (OI) has increased by 4.88% in the last 24 hours, to $1.49 billion. This indicates an increase in the notional value of active derivatives contracts, possibly due to increased capital or leverage exposure.
However, the long liquidations of $3.33 million in the last 24 hours outpace the short liquidations of $799,590, indicating a sell-side dominance.
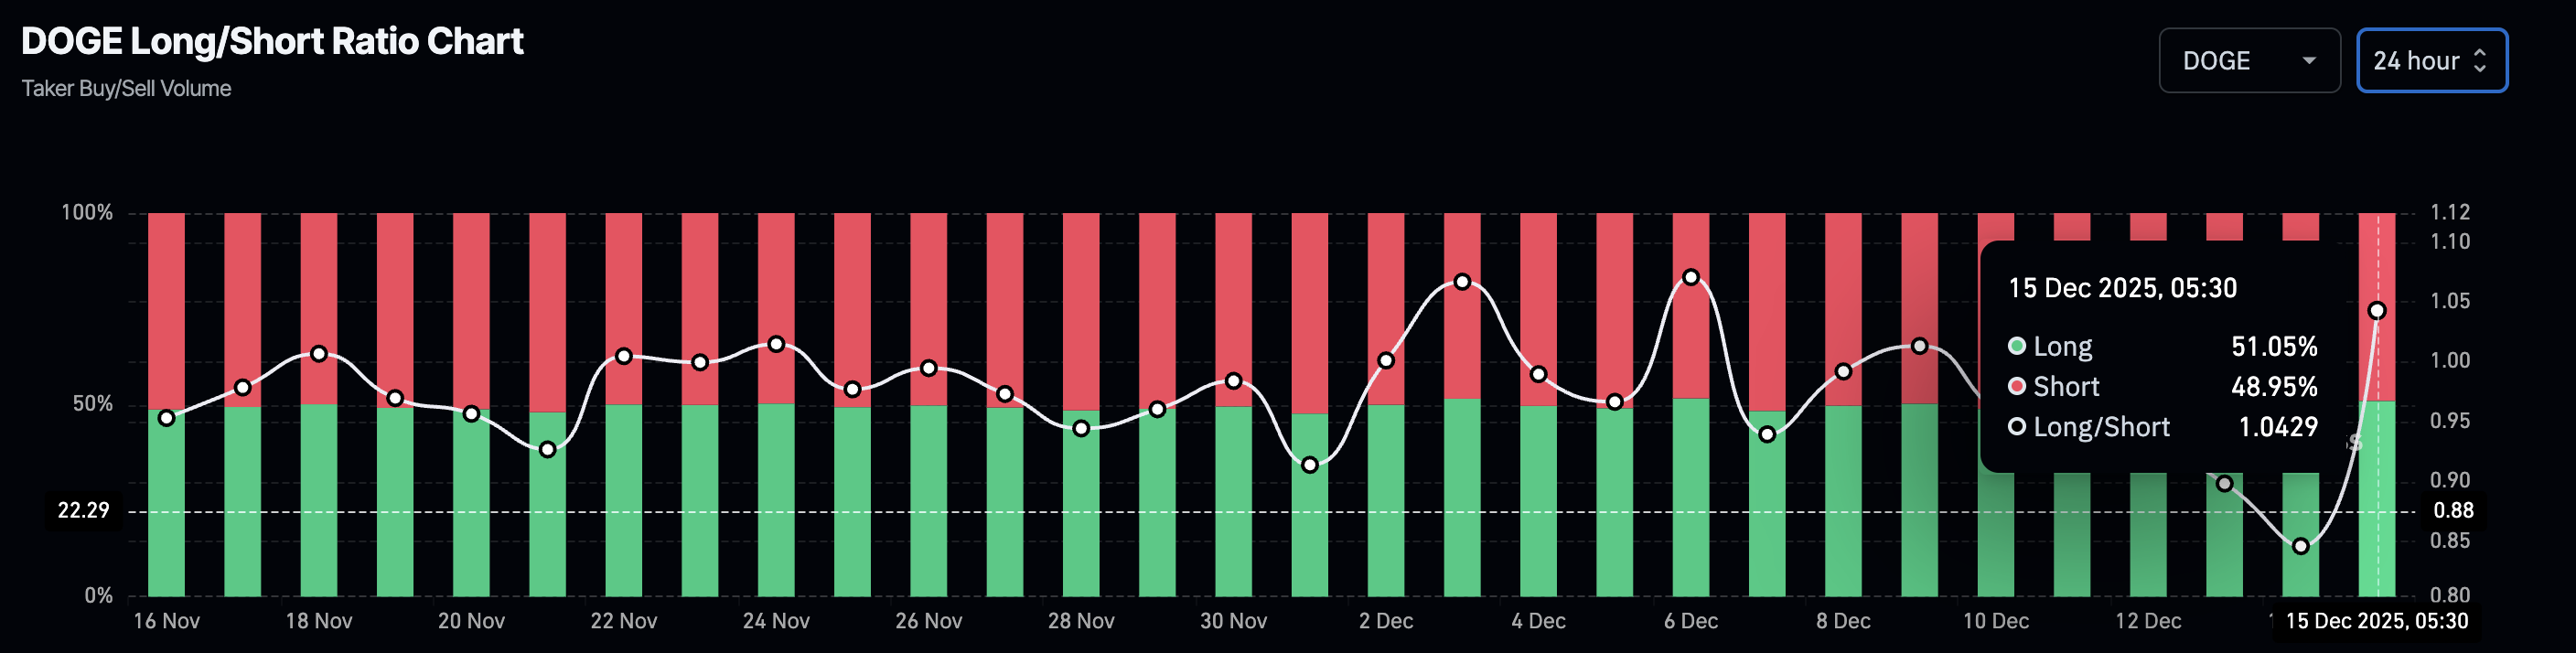
Still, the long-to-short ratio chart shows an increase in long positions to 51.05% on Monday, from 45.83% on Sunday, indicating a steady rise in bullish confidence.
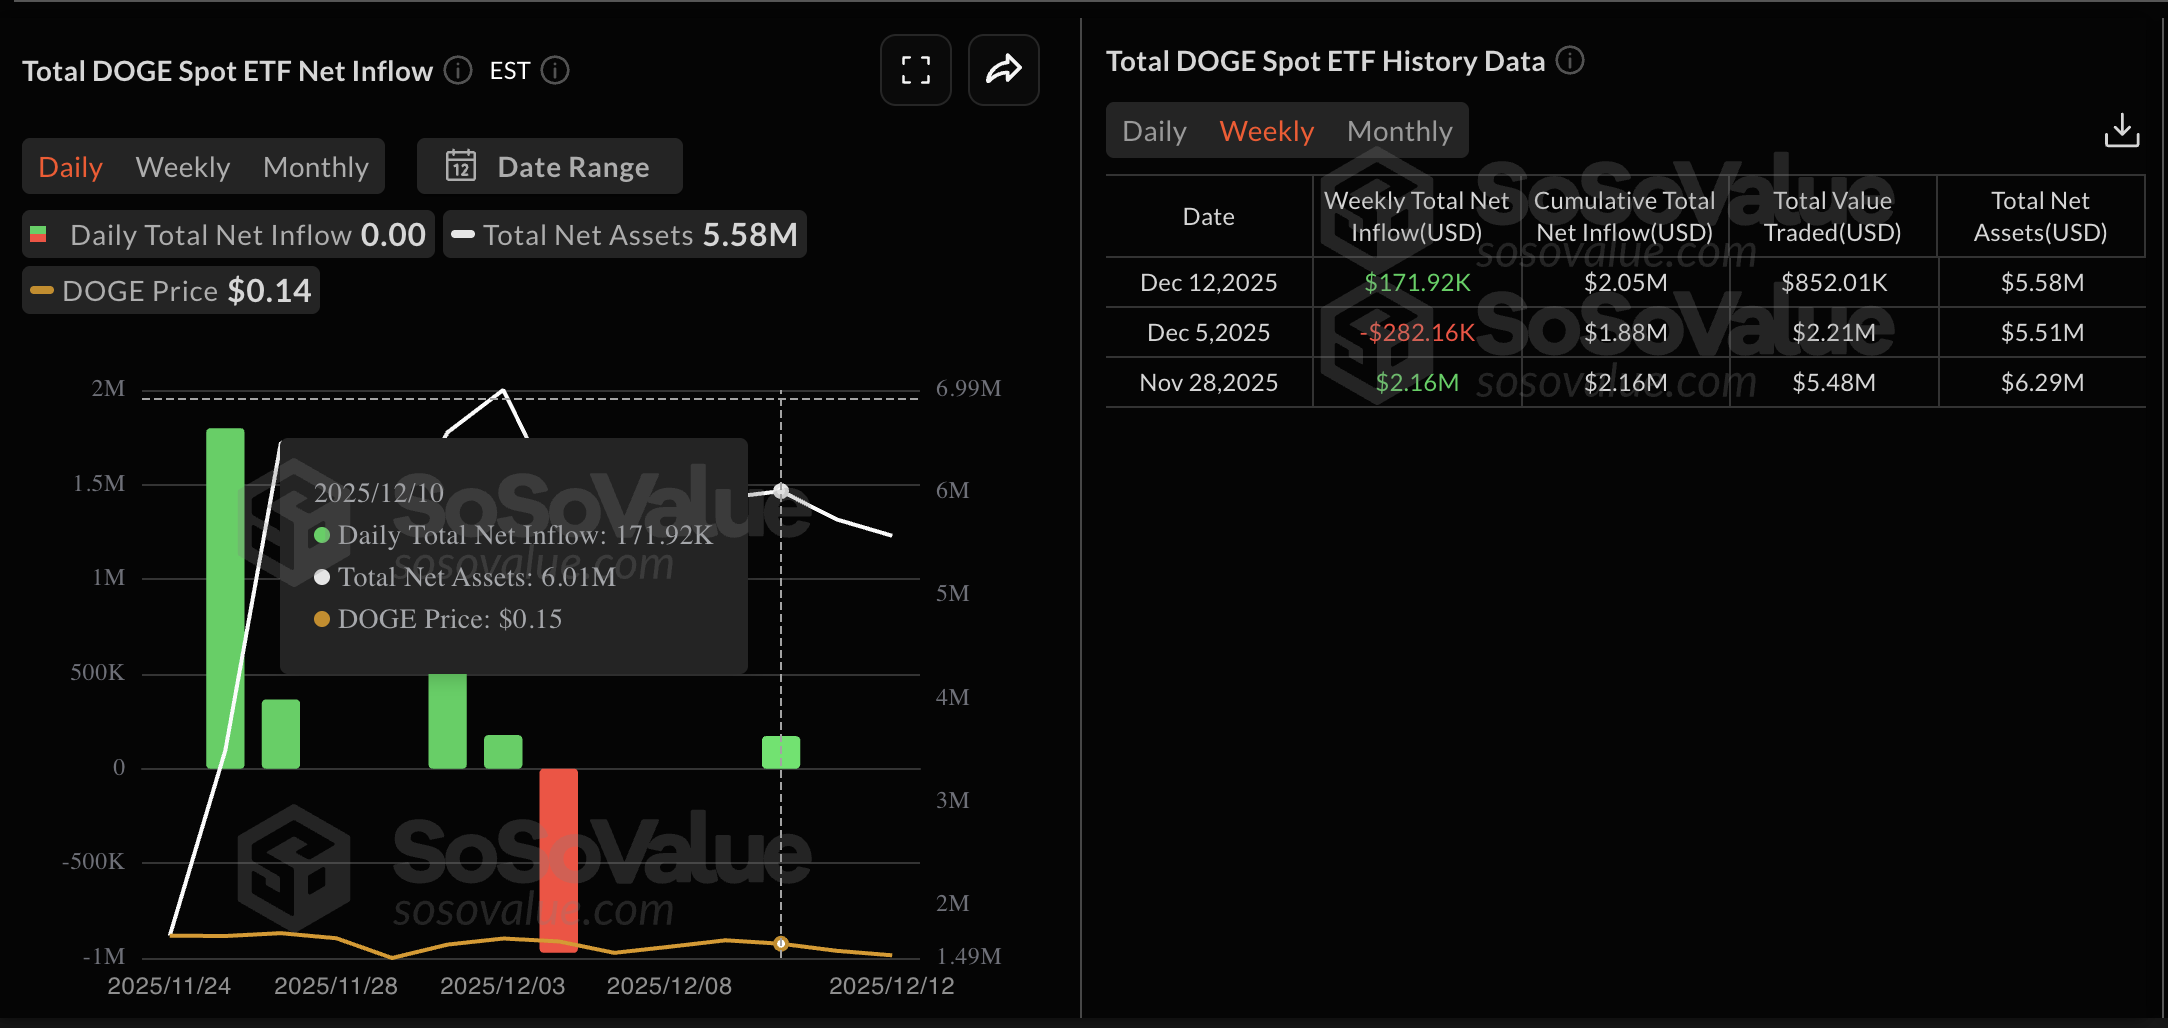
On the institutional side, the Sosovalue data shows that the Dogecoin ETFs recorded $171,920 in inflows last week. The inflow occurred on Wednesday, while the remaining days were recorded as net-zero flows, signaling reduced institutional interest in the meme coin.
Dogecoin’s consolidation at risk as buying pressure wanes
Dogecoin trades in a consolidation range extending between the November 21 low at $0.13321 and the November 26 high at $0.15681. At the time of writing, DOGE struggles to hold ground around the support level with a nearly 2% rise on Monday.
A potential rebound in the meme coin could target the overhead resistance at $0.15681, followed by the R1 Pivot Point at $0.17882, if it breaks free from the mentioned range.
However, the momentum indicators on the daily chart signal a loss in bullish momentum. The Relative Strength Index (RSI) at 40 steadies a lateral trend between the midpoint line and the oversold boundary, reflecting a bearish bias.
Meanwhile, the Moving Average Convergence Divergence (MACD) approaches its signal line, risking a crossover that would confirm a bearish trend in DOGE.
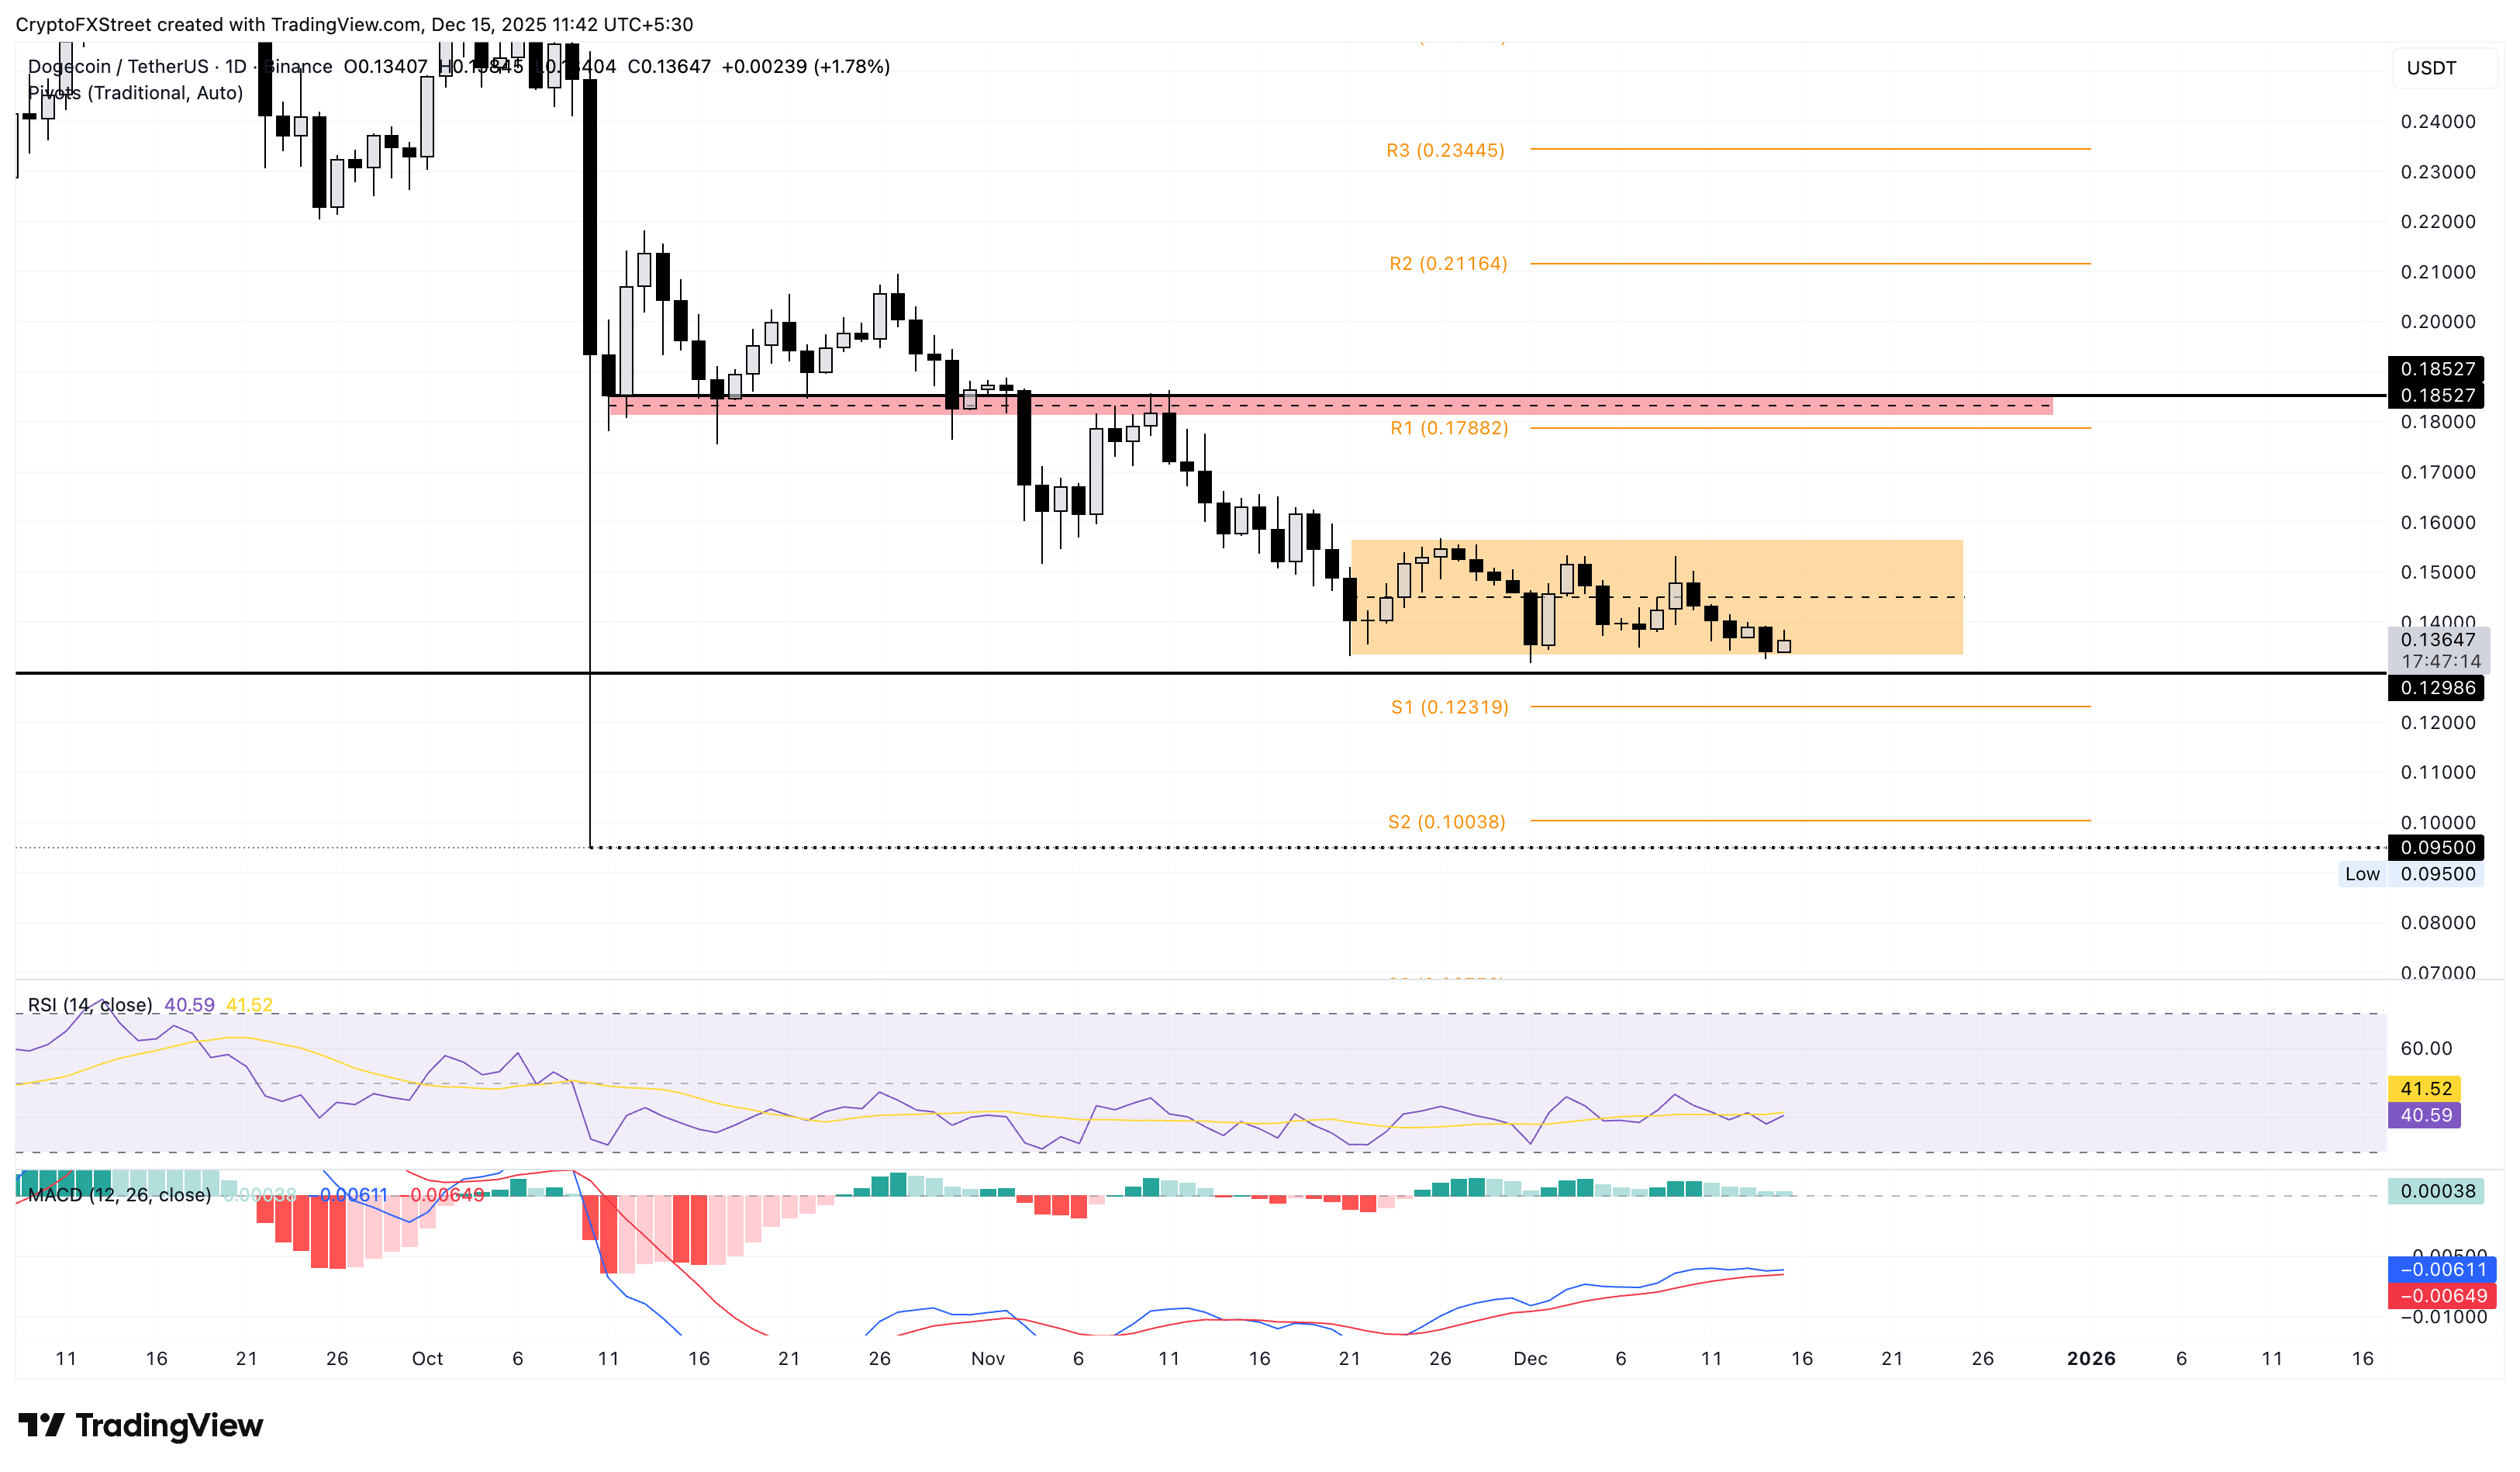
If DOGE clears below the $0.13321 support, it could threaten a decline below April’s low at $0.12986, targeting the S1 Pivot Point at $0.12319.
Related Articles
Amazon Stock Predictions for 2026 to 2030: Will They Exceed Expectations and Achieve Major Long-Term Goals?
TradingKey - As we head into 2026, many investors are questioning where Amazon (AMZN) fits into the technology world.
A Crash After a Surge: Why Silver Lost 40% in a Week?
TradingKey - Spot silver (XAGUSD) prices continue to decline. Silver plunged 20% on Thursday, breaking below $71 per ounce, with the sell-off intensifying on Friday as prices fell further below $64. Compared to the all-time high set on January 29, silver prices have retraced more than 40%, wiping out nearly all gains accumulated over the previous month.
Google Cloud Revenue Surges 48% in Q4 as CapEx Guidance Nearly Doubles: Why the 7.5% After-Hours Dip?
TradingKey - After the close on February 4 (ET), Google (GOOG, GOOGL) released stellar Q4 results: total revenue grew 18% year-over-year, hitting a new quarterly record after revenue first surpassed $100 billion in Q3. The primary highlight was Google Cloud, where Q4 revenue surged 48% year-over-yea
Is Bitcoin’s Four-Year Cycle Dead in 2026?
Is the Bitcoin 4-year cycle dead? After 2025 broke historical records with a red post-halving year, institutional analysts explore if the Bitcoin price has decoupled from the halving countdown. Analyze the impact of spot ETFs, global liquidity, and the roadmap to the 2028 halving in this 2026 market

