

Cardano Price Forecast: ADA stabilizes near $0.42 as on-chain signals point to further recovery

- Cardano price holds around $0.42 on Tuesday, up nearly 5% from the previous day.
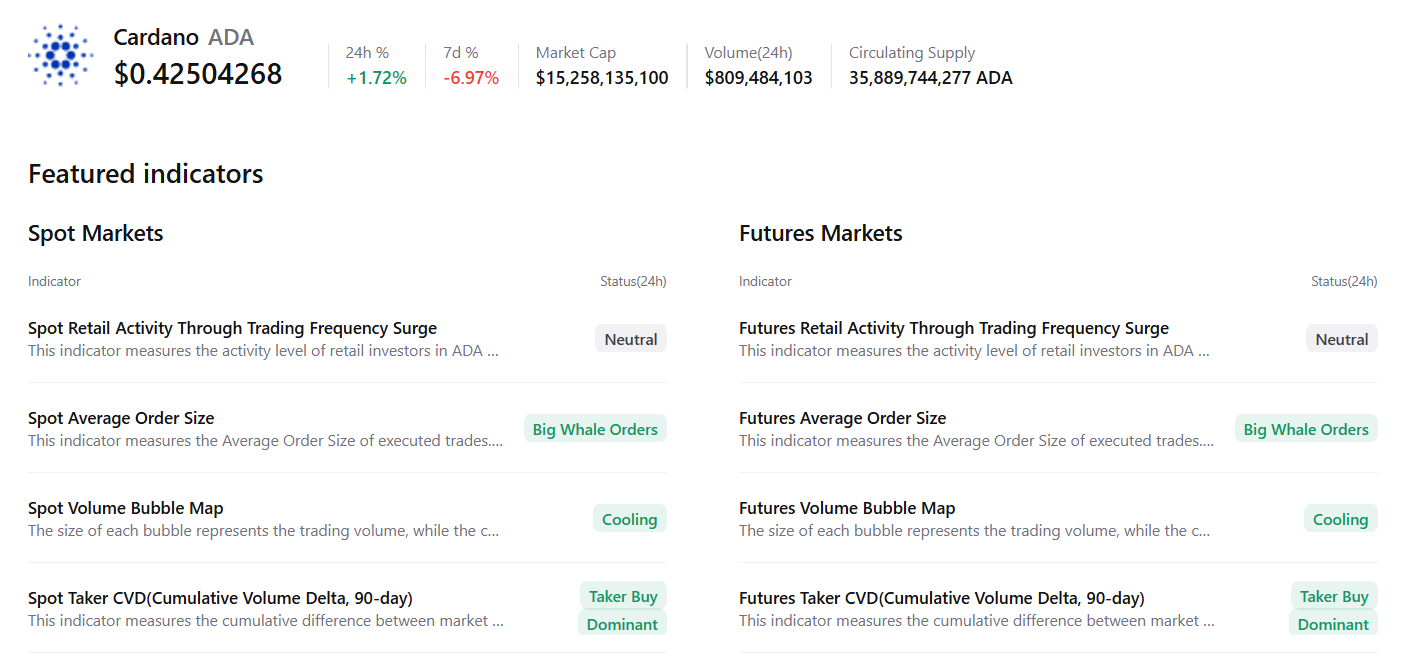
- Metrics suggest improving sentiment, with large whale orders, buy-side dominance, and a positive funding rate supporting the recovery outlook.
- The technical setup favors continued upside, with ADA eyeing a potential move toward the $0.50 resistance zone.
Cardano (ADA) price steadies around $0.42 at the time of writing on Tuesday after gaining nearly 5% in the previous day. On-chain and derivatives data paint a bullish picture, with large whale orders and buy-side dominance rising alongside positive funding rates. On the technical side, it also favours further recovery, with ADA targeting $0.50.
On-chain and derivatives data show a bullish bias
CryptoQuant’s summary data supports the positive outlook, as ADA’s spot and futures markets show large whale orders, cooling conditions, and buy dominance, signaling a potential recovery ahead.
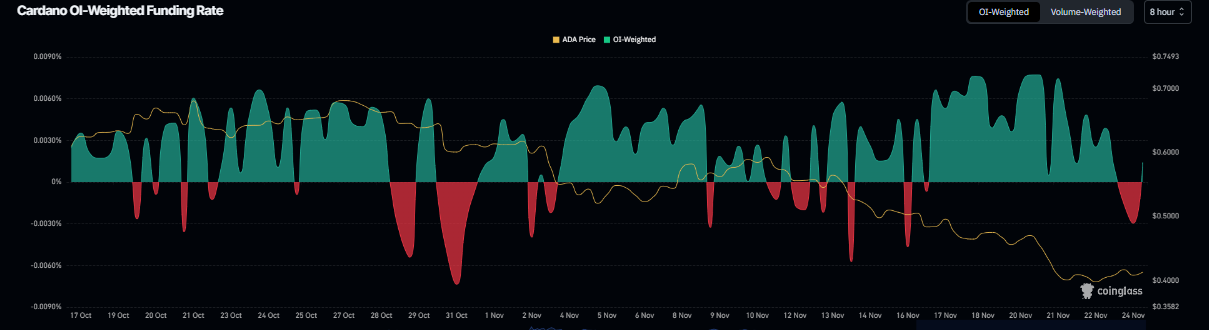
Apart from whale accumulation, derivatives data also support a recovery rally for Cardano. Coinglass’s OI-Weighted Funding Rate data shows that the number of traders betting that the price of ADA will slide further is lower than those anticipating a price increase.
The metric has flipped to a positive rate, standing at 0.0014% on Tuesday, indicating that longs are paying shorts. Historically, as shown in the chart below, when the funding rates have flipped from negative to positive, Cardano’s price has rallied sharply.
Cardano Price Forecast: ADA bulls aiming for the $0.50 mark
Cardano price found support around the lower boundary of the falling wedge pattern (drawn by connecting multiple highs and lows with two trendlines) on Saturday and recovered by 6% in the next two days. At the time of writing on Tuesday, ADA hovers around $0.42.
If ADA continues its recovery, it could extend the rally toward the next daily resistance at $0.49. A successful close above this level could extend additional gains toward the key psychological level at $0.50.
The Relative Strength Index (RSI) on the daily chart reads 30, after slipping below the oversold threshold last week, and is currently pointing upward, suggesting that downside pressure may be moderating as bearish momentum shows early signs of exhaustion. The Moving Average Convergence Divergence (MACD) lines are converging and nearing a bullish crossover, providing further technical support for the potential continuation of the recovery.
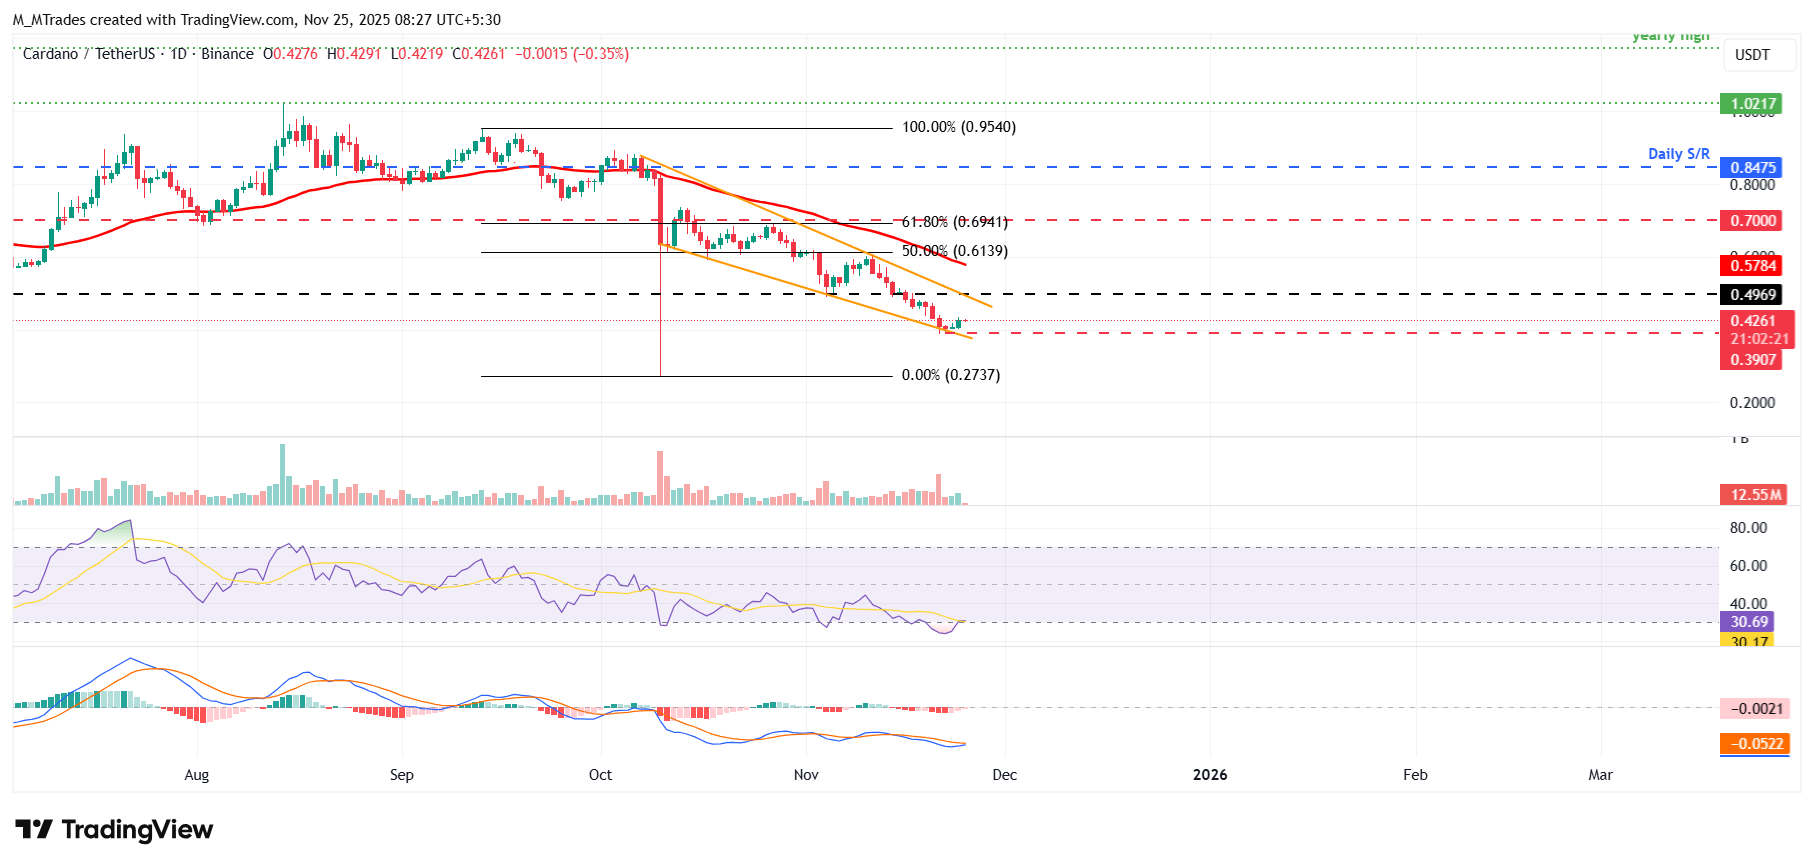
On the other hand, if ADA faces a correction, it could extend the decline toward the lower trendline boundary at around $0.39.
Related Articles
Amazon Stock Predictions for 2026 to 2030: Will They Exceed Expectations and Achieve Major Long-Term Goals?
TradingKey - As we head into 2026, many investors are questioning where Amazon (AMZN) fits into the technology world.
A Crash After a Surge: Why Silver Lost 40% in a Week?
TradingKey - Spot silver (XAGUSD) prices continue to decline. Silver plunged 20% on Thursday, breaking below $71 per ounce, with the sell-off intensifying on Friday as prices fell further below $64. Compared to the all-time high set on January 29, silver prices have retraced more than 40%, wiping out nearly all gains accumulated over the previous month.
Is Bitcoin’s Four-Year Cycle Dead in 2026?
Is the Bitcoin 4-year cycle dead? After 2025 broke historical records with a red post-halving year, institutional analysts explore if the Bitcoin price has decoupled from the halving countdown. Analyze the impact of spot ETFs, global liquidity, and the roadmap to the 2028 halving in this 2026 market
USD Dollar Trend Forecast: Dollar Index Falls Below 97.0 to 4-Year Low, Will the Dollar Continue To Fall or Bottom Out in 2026?
TradingKey - In January 2026, the US Dollar Index continued its downward trend from 2025, officially breaking below the key 97.0 level and reaching a low of 95.5, marking a nearly four-year low since February 2022.

