Top Crypto Losers: Starknet, Telcoin and MYX Finance extend losses as Bitcoin dips below $86,000

- Starknet price trades in red on Friday after falling more the 10% in the previous day.
- Telcoin price slips below $0.005, extending losses.
- MYX Finance trades below $2.47 after being rejected by the 50-day EMA earlier this week.
Starknet (STRK), Telcoin (TEL) and MYX Finance (MYX) continued to face selling pressure on Friday as Bitcoin (BTC) slipped below $86,000, dragging smaller cryptocurrencies down. According to the CoinGecko data, STRK, TEL, and MYX have corrected by more than 18% over the last 24 hours. The technical outlook for these altcoins suggests further losses as the broader bearish sentiment dominates the crypto market.
Starknet faces rejection from the key resistance zone
Starknet price retested the 61.8% Fibonacci retracement level at $0.26 (drawn from January 21 high of $0.40 to the October low at $0.03) on Wednesday and declined 10.36% the next day. At the time of writing on Friday, STRK continues to trade down at $0.22.
If STRK continues its correction, it could extend the decline toward the daily support at $0.15.
The Relative Strength Index (RSI) on the daily chart stands at 63, having pulled back from the overbought zone earlier this week and signaling a fading bullish momentum. If the RSI drops below the neutral 50 level, STRK could be at risk of a deeper correction.
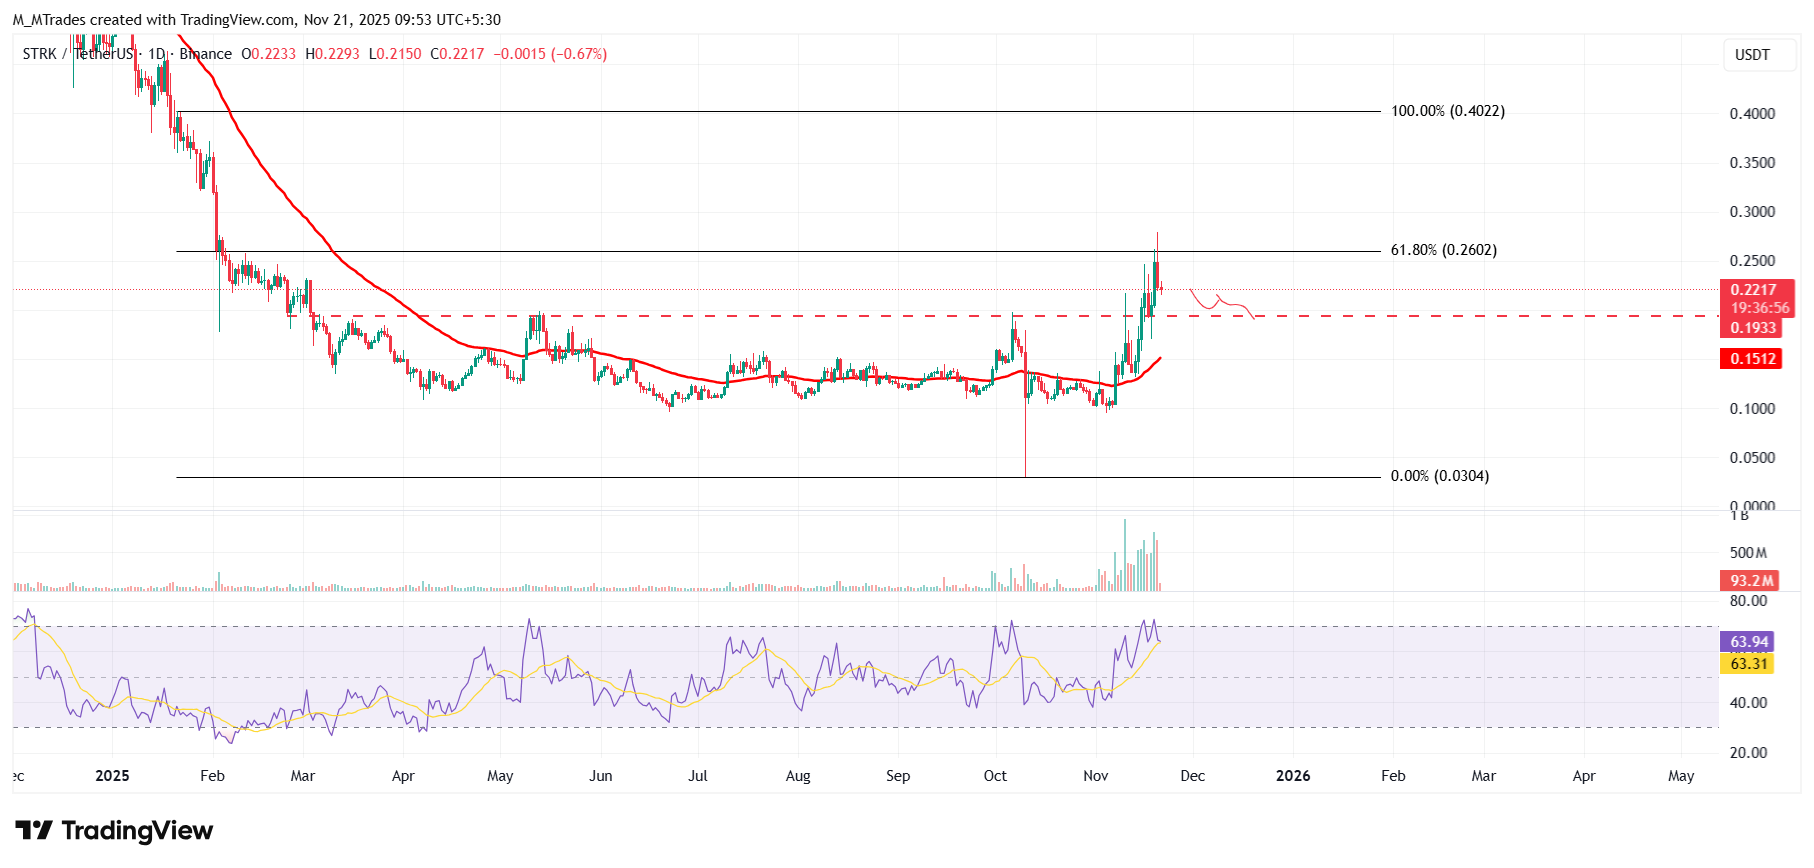
On the other hand, if STRK recovers, it could extend the recovery toward the 61.8% Fibonacci level at $0.26.
Telcoin slips below $0.005, as bears tighten control
Telcoin's price faced rejection at the daily resistance of $0.007 on Tuesday and declined by more than 21% over the next two days. At the time of writing on Friday, TEL continues to trade down at $0.005.
If TEL continues its pullback, it could extend the decline toward the 50-day Exponential Moving Average (EMA) at $0.004.
The RSI on the daily chart stands at 54, having pulled back from the overbought zone earlier this week and signaling a fading bullish momentum. If the RSI drops below the neutral 50 level, Telcoin could be at risk of a deeper correction.
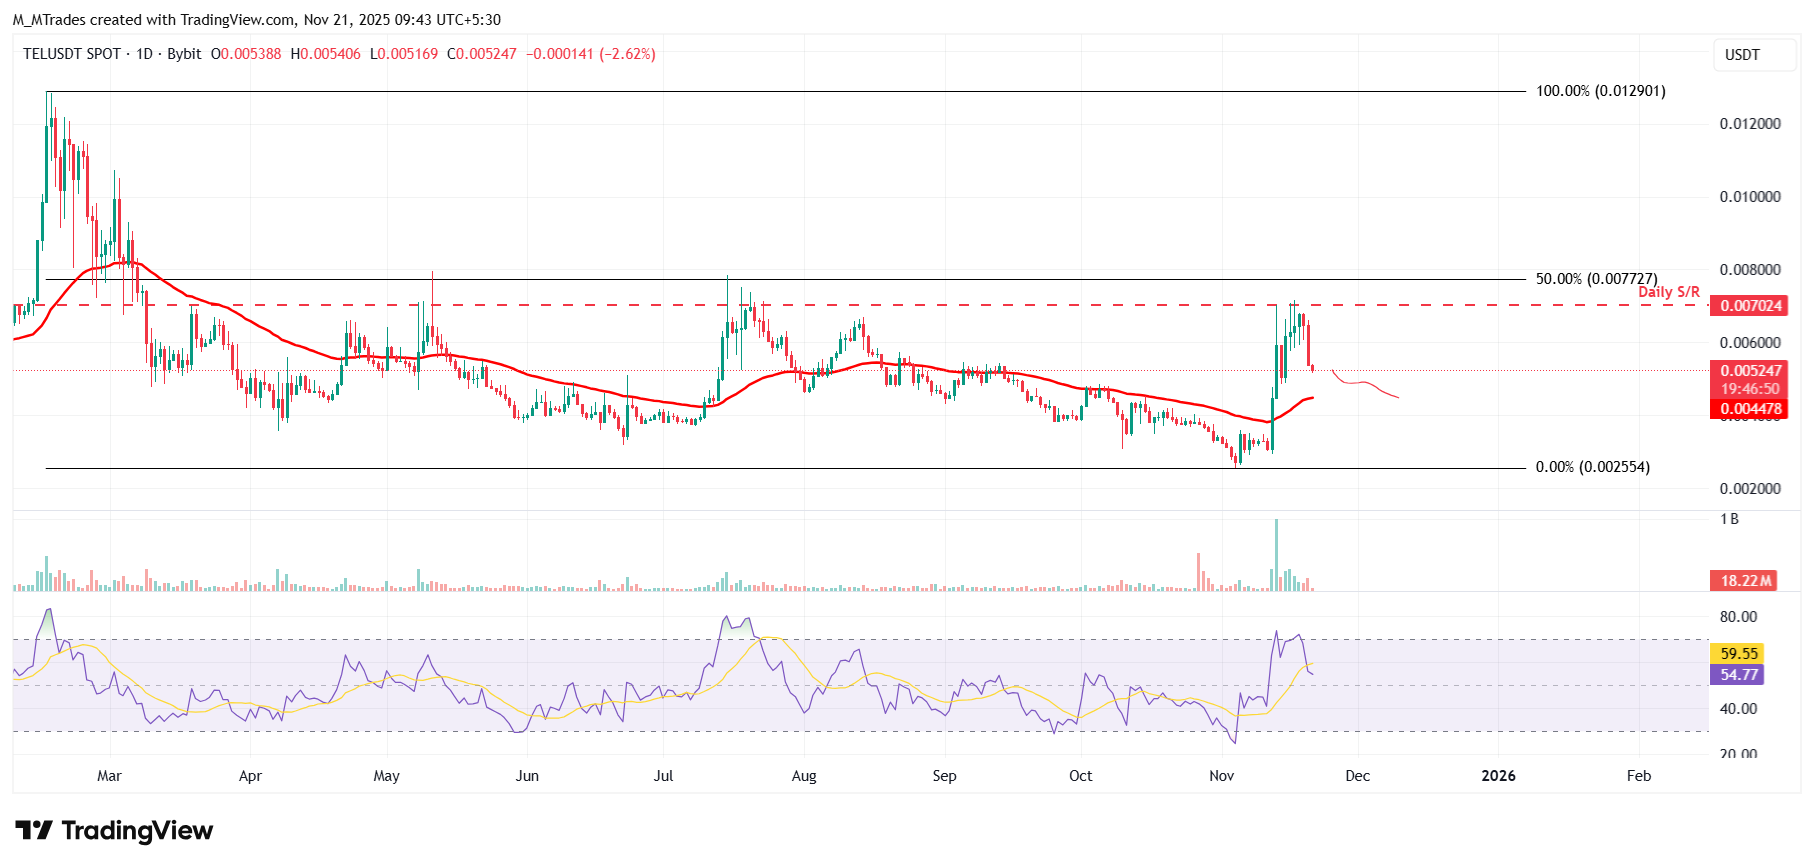
However, if TEL recovers, it could extend the rally toward the daily resistance at $0.007.
MYX Finance shows bearish signs in the momentum indicator
MYX Finance price faced rejection from the 50-day EMA at $3.49 on Wednesday and declined 17% the next day. This 50-day EMA roughly coincides with the daily resistance at $3.36, making this a key resistance zone. At the time of writing on Friday, MYX is trading red at around $2.49.
If MYX continues its correction, it could extend the decline toward the November 3 low of $1.69.
The RSI reads 45, below its neutral level of 50, indicating bearish momentum gaining traction.
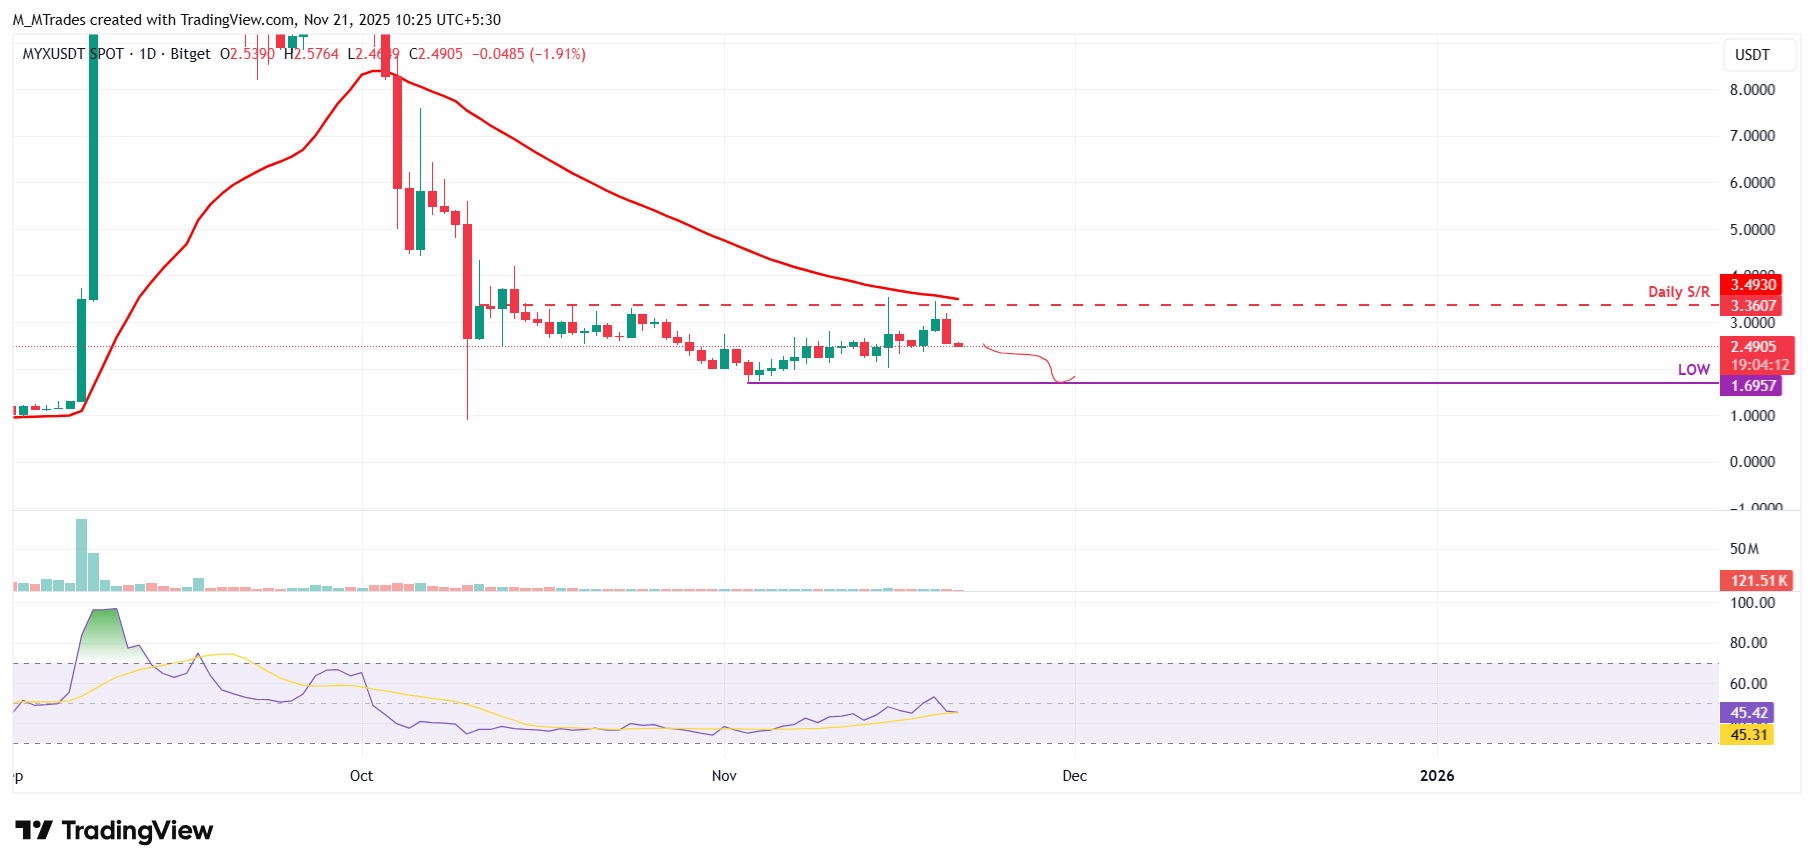
If MYX recovers, it could extend the recovery toward the 50-day EMA at $3.49.
Related Articles
Amazon Stock Predictions for 2026 to 2030: Will They Exceed Expectations and Achieve Major Long-Term Goals?
TradingKey - As we head into 2026, many investors are questioning where Amazon (AMZN) fits into the technology world.
A Crash After a Surge: Why Silver Lost 40% in a Week?
TradingKey - Spot silver (XAGUSD) prices continue to decline. Silver plunged 20% on Thursday, breaking below $71 per ounce, with the sell-off intensifying on Friday as prices fell further below $64. Compared to the all-time high set on January 29, silver prices have retraced more than 40%, wiping out nearly all gains accumulated over the previous month.
Is Bitcoin’s Four-Year Cycle Dead in 2026?
Is the Bitcoin 4-year cycle dead? After 2025 broke historical records with a red post-halving year, institutional analysts explore if the Bitcoin price has decoupled from the halving countdown. Analyze the impact of spot ETFs, global liquidity, and the roadmap to the 2028 halving in this 2026 market
Disney Trend Forecast: Disney FY26 First Quarter Net Profit Falls 6% Stock Price Slumps 7.4% Can Stock Price Continue to Rise in 2026?
TradingKey - At the start of 2026, global entertainment giant Disney (DIS) faced a disappointing start to the year. Its Q1 FY2026 earnings report showed that revenue grew 5% year-on-year to $25.98 billion, seemingly achieving steady growth; however, net profit fell 6% year-on-year to $2.4 billion. N