

Solana Price Forecast: SOL steadies near $140 as new spot ETFs launch, boosts sentiment

- Solana price hovers around $140 on Wednesday, after rebounding from its key support level the previous day.
- Canary Capital and Fidelity announced the launch of their spot Solana ETFs SOLC and FSOL on Tuesday, boosting market sentiment.
- The technical outlook suggests further recovery if SOL holds above $128.68, the weekly support level.
Solana (SOL) price trades around $140 at the time of writing on Wednesday after rebounding from a key support level the previous day. Canary Capital and Fidelity announced the launch of their spot Solana Exchange Traded Funds (ETFs), SOLC and FSOL, on Tuesday, lifting market sentiment amid growing institutional interest. The technical outlook suggests further upside if SOL holds above the weekly support level at $128.68.
Institutional demand rises as multiple asset managers launch Solana ETFs
Canary Capital announced the launch of its spot Solana ETF, SOLC, on Tuesday, coinciding with Fidelity’s debut of the FSOL Solana ETF on the same day.
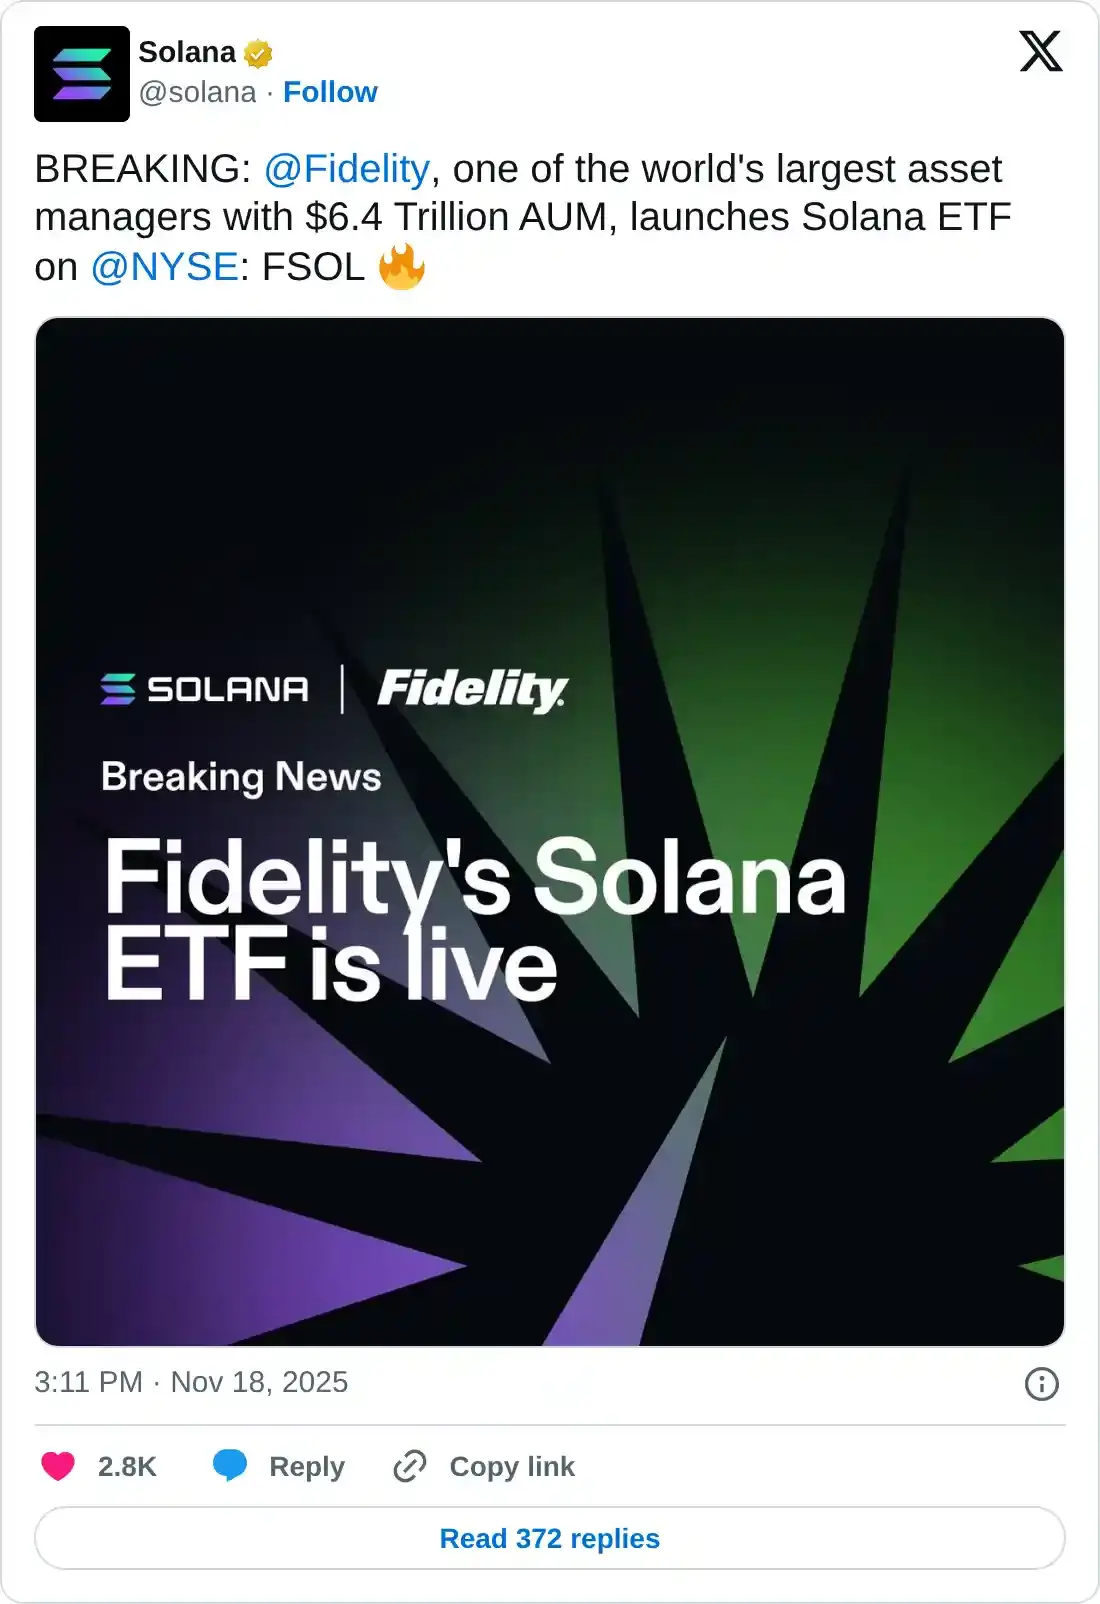
Fidelity becomes the fourth asset manager to roll out an SOL ETF and the first from the firm to feature staking. Moreover, Bitwise, which launched its product in late October, and Grayscale, whose fund also includes a staking component.
This succession of launches underscores accelerating institutional interest in Solana-based investment products, which projects a bullish outlook for Solana and its native token in the long term.
Solana Price Forecast: SOL momentum indicators hint at fading bearish strength
Solana price faced rejection at the daily level of $168.79 on November 11 and declined 22% over the next 6 days. On Tuesday, it recovered more than 7% after retesting the weekly support at $128.68. At the time of writing on Wednesday, it hovers around $139.71.
If the weekly support at $128.68 continues to hold, it could extend the recovery toward the next resistance at $160.
The Relative Strength Index (RSI) on the daily chart is 35, rebounding from the oversold territory, suggesting bearish momentum may be slowing and a potential short-term rebound could emerge.
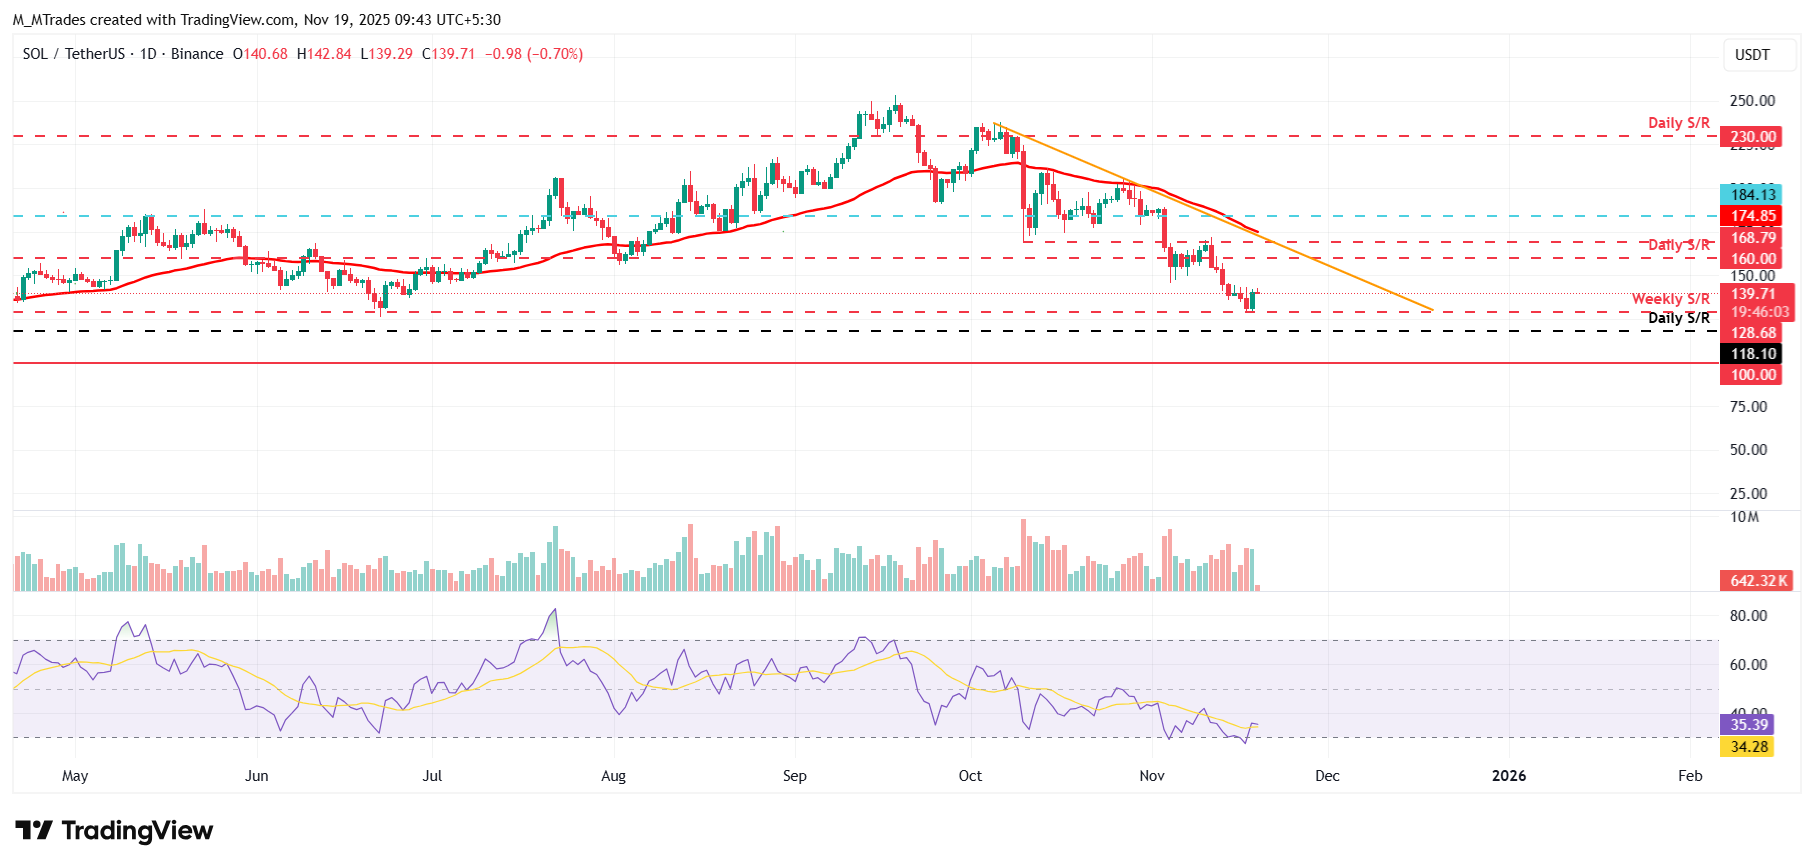
On the other hand, if SOL closes below $128.68, it could extend the decline toward the next daily support at $118.10.
Related Articles
Amazon Stock Predictions for 2026 to 2030: Will They Exceed Expectations and Achieve Major Long-Term Goals?
TradingKey - As we head into 2026, many investors are questioning where Amazon (AMZN) fits into the technology world.
A Crash After a Surge: Why Silver Lost 40% in a Week?
TradingKey - Spot silver (XAGUSD) prices continue to decline. Silver plunged 20% on Thursday, breaking below $71 per ounce, with the sell-off intensifying on Friday as prices fell further below $64. Compared to the all-time high set on January 29, silver prices have retraced more than 40%, wiping out nearly all gains accumulated over the previous month.
Google Cloud Revenue Surges 48% in Q4 as CapEx Guidance Nearly Doubles: Why the 7.5% After-Hours Dip?
TradingKey - After the close on February 4 (ET), Google (GOOG, GOOGL) released stellar Q4 results: total revenue grew 18% year-over-year, hitting a new quarterly record after revenue first surpassed $100 billion in Q3. The primary highlight was Google Cloud, where Q4 revenue surged 48% year-over-yea
Is Bitcoin’s Four-Year Cycle Dead in 2026?
Is the Bitcoin 4-year cycle dead? After 2025 broke historical records with a red post-halving year, institutional analysts explore if the Bitcoin price has decoupled from the halving countdown. Analyze the impact of spot ETFs, global liquidity, and the roadmap to the 2028 halving in this 2026 market

