

BNB Price Forecast: BNB risks over 15% correction as on-chain, retail demand plummets

- BNB price extends decline below $1,000 on Tuesday as bulls fail to surpass a key resistance trendline.
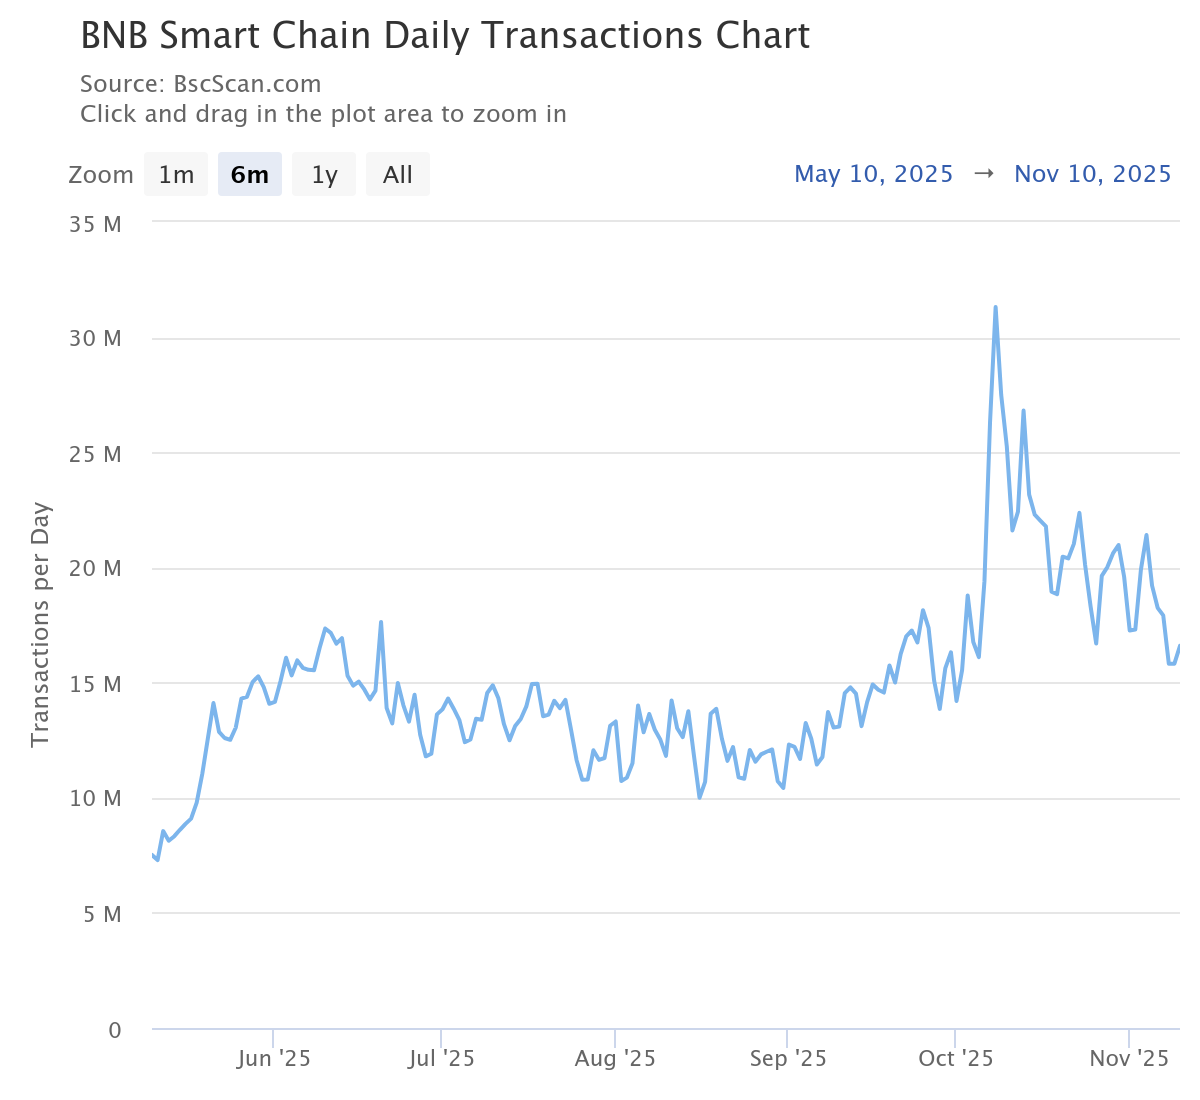
- On-chain data shows a declining trend in BNB Chain transactions, signaling lower demand.
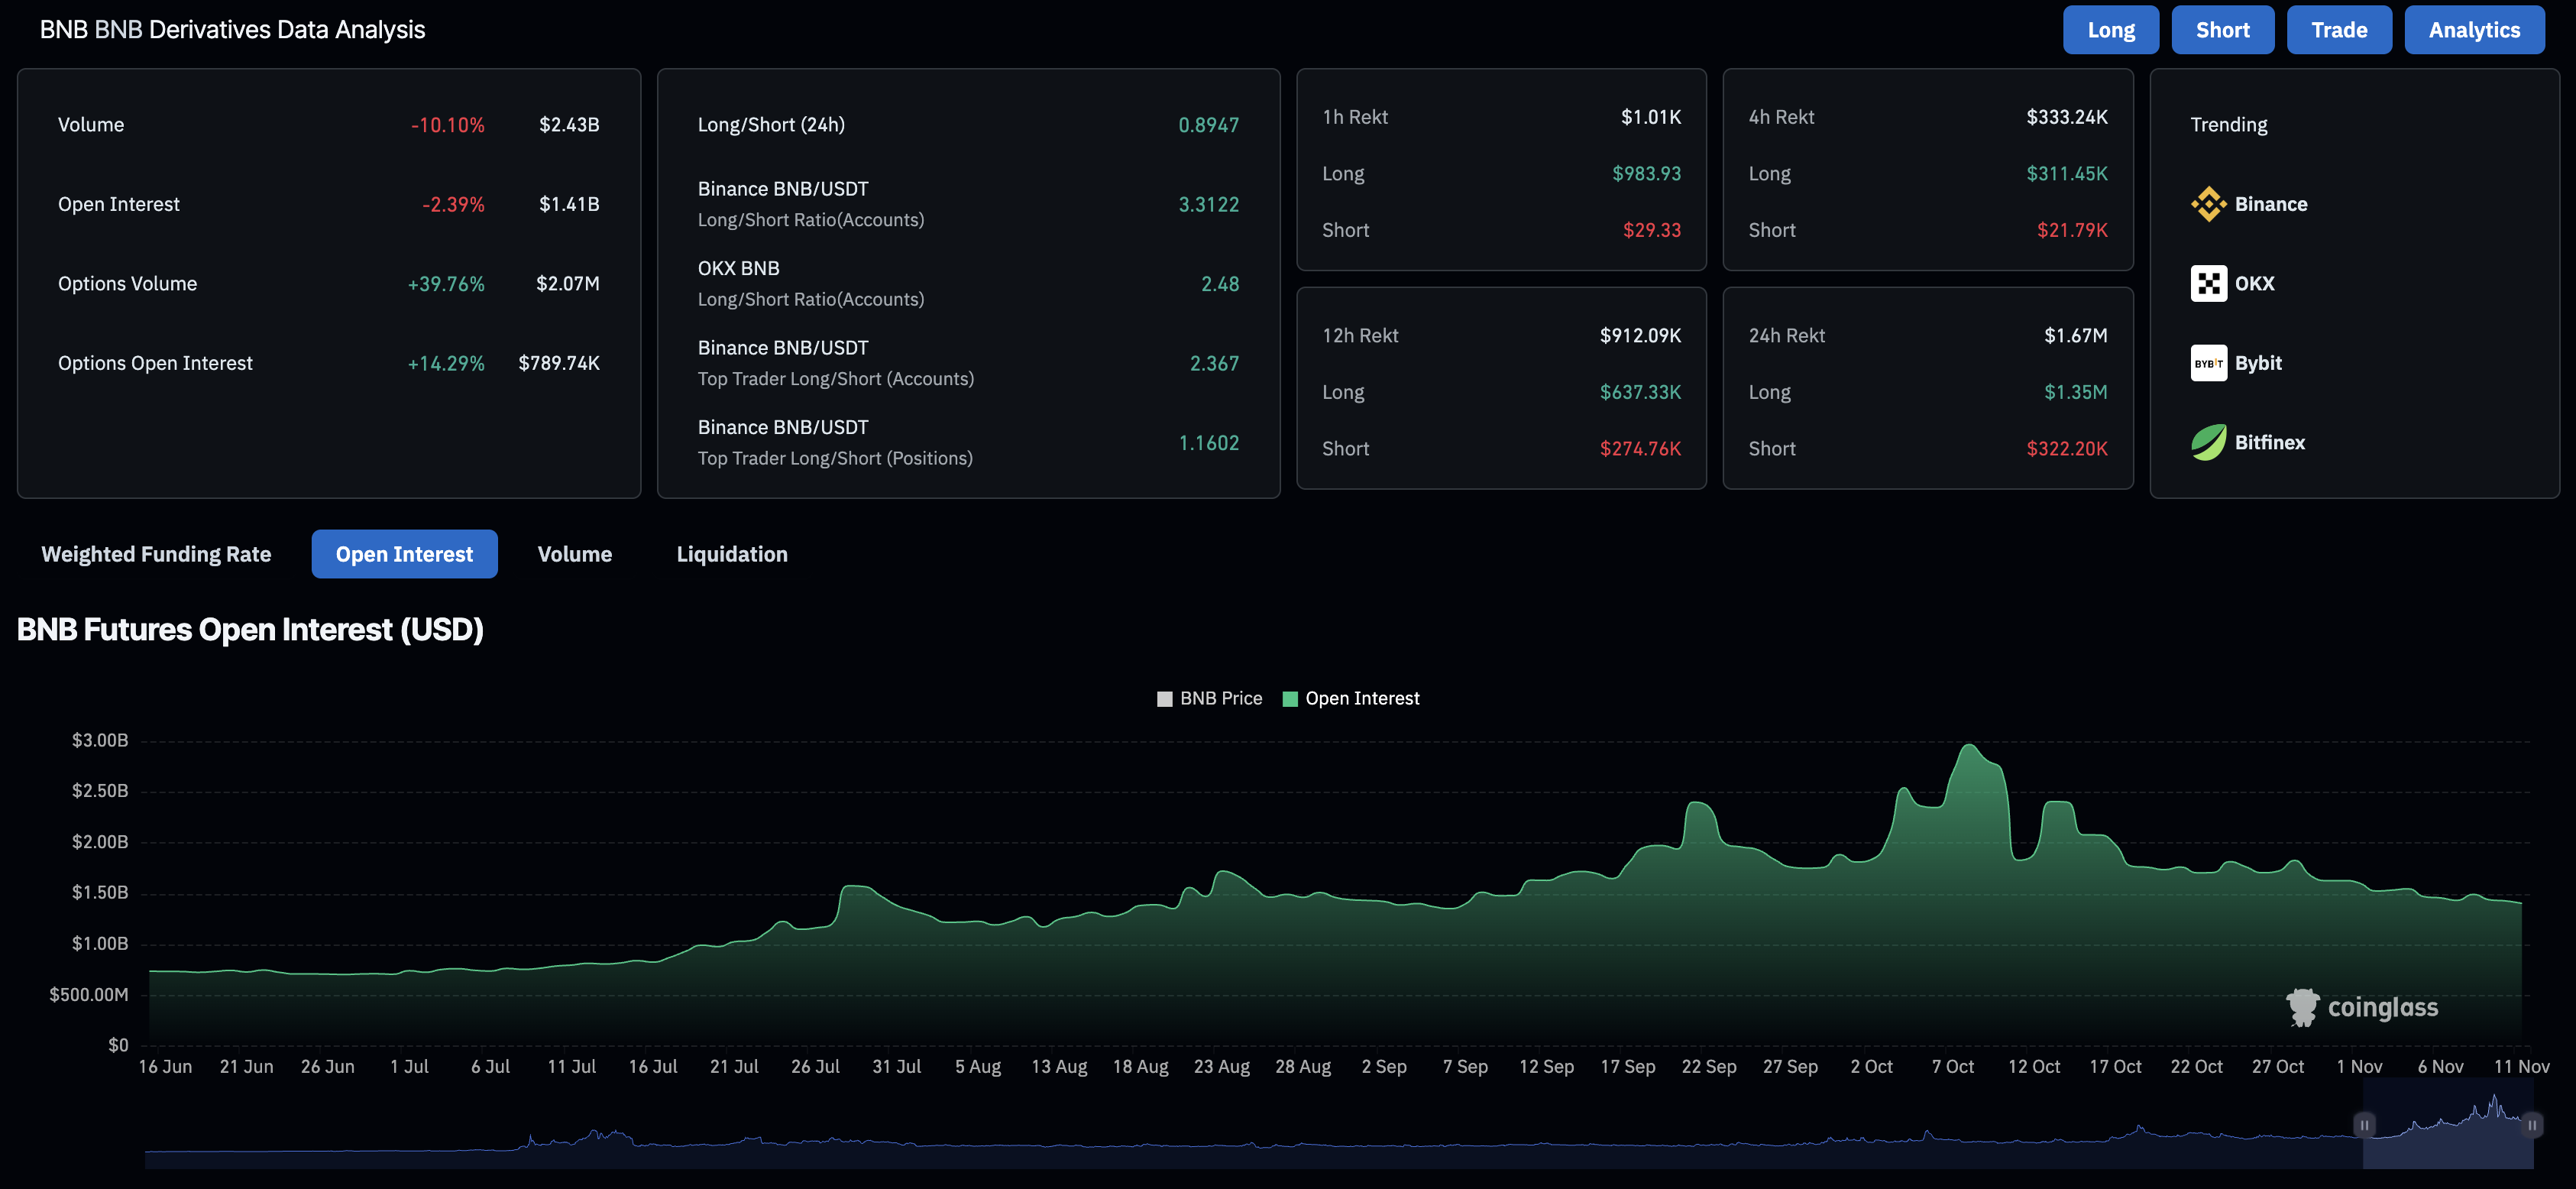
- A steady decline in BNB futures Open Interest as the funding rate flips negative suggests a risk-off sentiment among traders.
BNB (previously called Binance Coin) price edges lower by nearly 2% at press time on Tuesday, failing to hold above the $1,000 psychological level. Both the derivatives and on-chain data indicate lower demand as BNB futures Open Interest (OI) and transaction numbers decline. The technical outlook remains bearish as sellers regain trend control, extending the late October breakout of a bearish flag.
Demand declines for BNB Chain at the retail and on-chain levels
BNB Chain (previously known as Binance Smart Chain) is experiencing a decline in user activity, as evidenced by a decrease in transaction numbers. BscScan data shows a declining trend in the number of transactions to 16.59 million on Monday from 31.30 million on October 8.
On the other hand, a similar declining trend is visible in the BNB futures Open Interest (OI), indicating that traders are reducing their risk exposure. CoinGlass data indicates a 2.39% decline over the last 24 hours, with a current value of $1.41 billion.
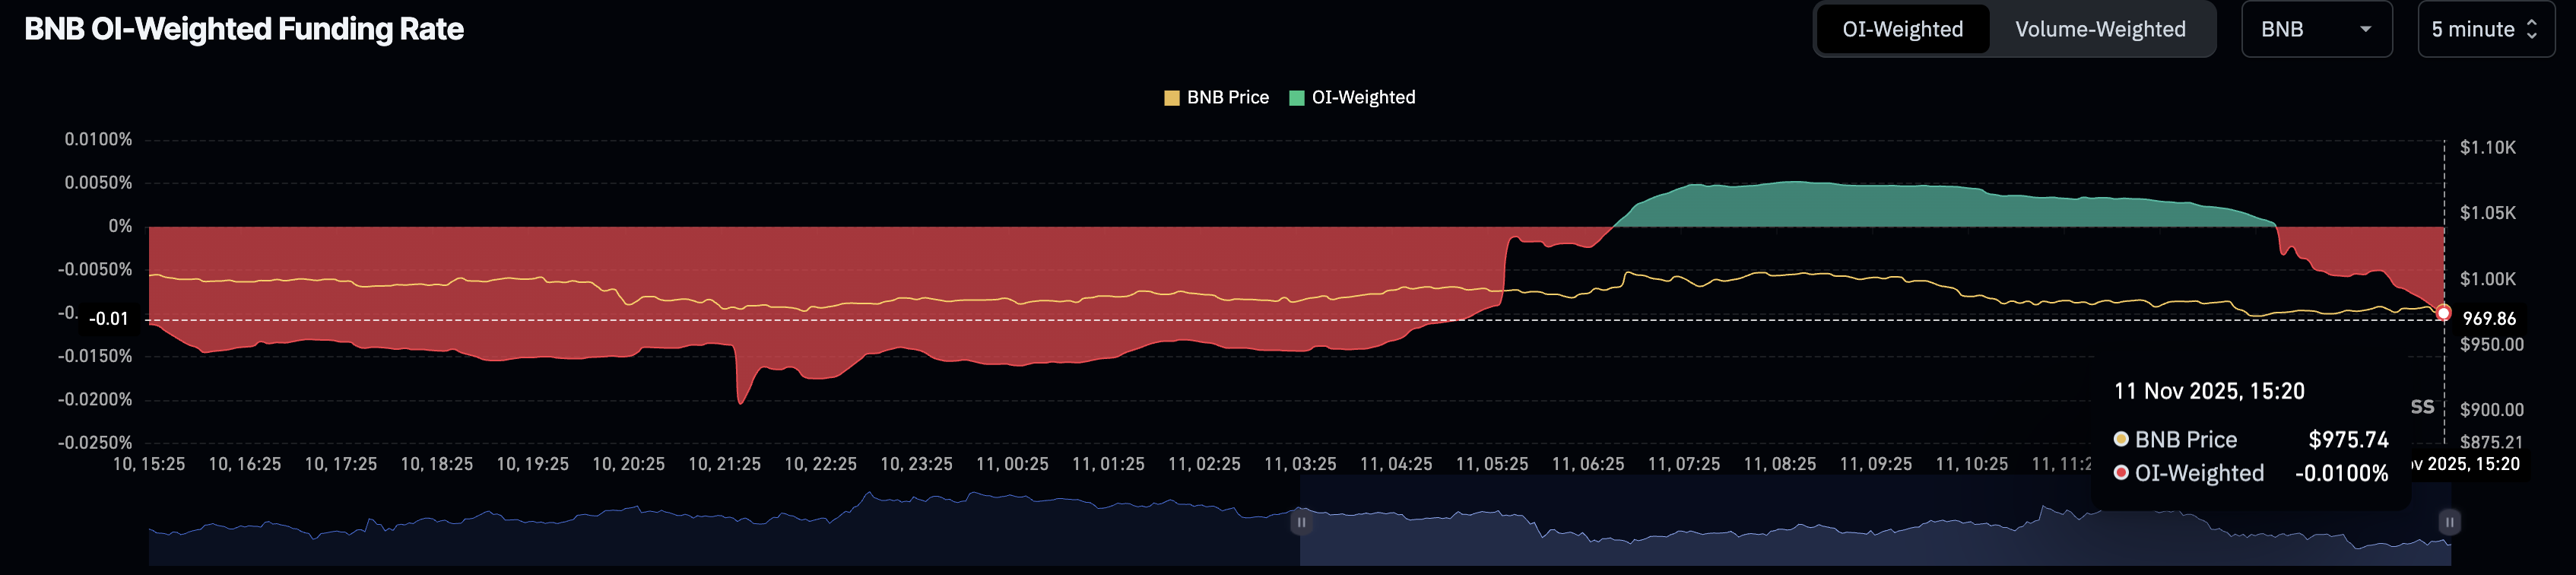
Corroborating the risk-off sentiment, the OI-weighted funding rate turns negative as BNB reverses from the $1,000 level, standing at -0.0100% compared to 0.0051% earlier in the day. This flip suggests a sell-side dominance with bears paying a premium to hold short positions.
Technical outlook: BNB risks further correction below $850
BNB extends the reversal from a resistance trendline near the $1,000 level on the 4-hour chart, formed by connecting the October 13 and 27 peaks. BNB bears threaten the September 26 low at $932, risking a retest of last week’s low at $880.
Still, a breakout of a bearish flag on the same chart in late October targets the $819 support level, last tested on August 20, calculated by tracing the pattern’s height on the downside from the confirmation candle.
The technical indicators on the 4-hour chart indicate a slowdown in buying pressure as the Relative Strength Index (RSI) at 45 slips below the midline, potentially extending a downward trend. The further room on the downside before reaching the oversold zone indicates bearish potential.
At the same time, the Moving Average Convergence Divergence (MACD) crosses below the signal line, flashing a sell signal and renewed bearish momentum.
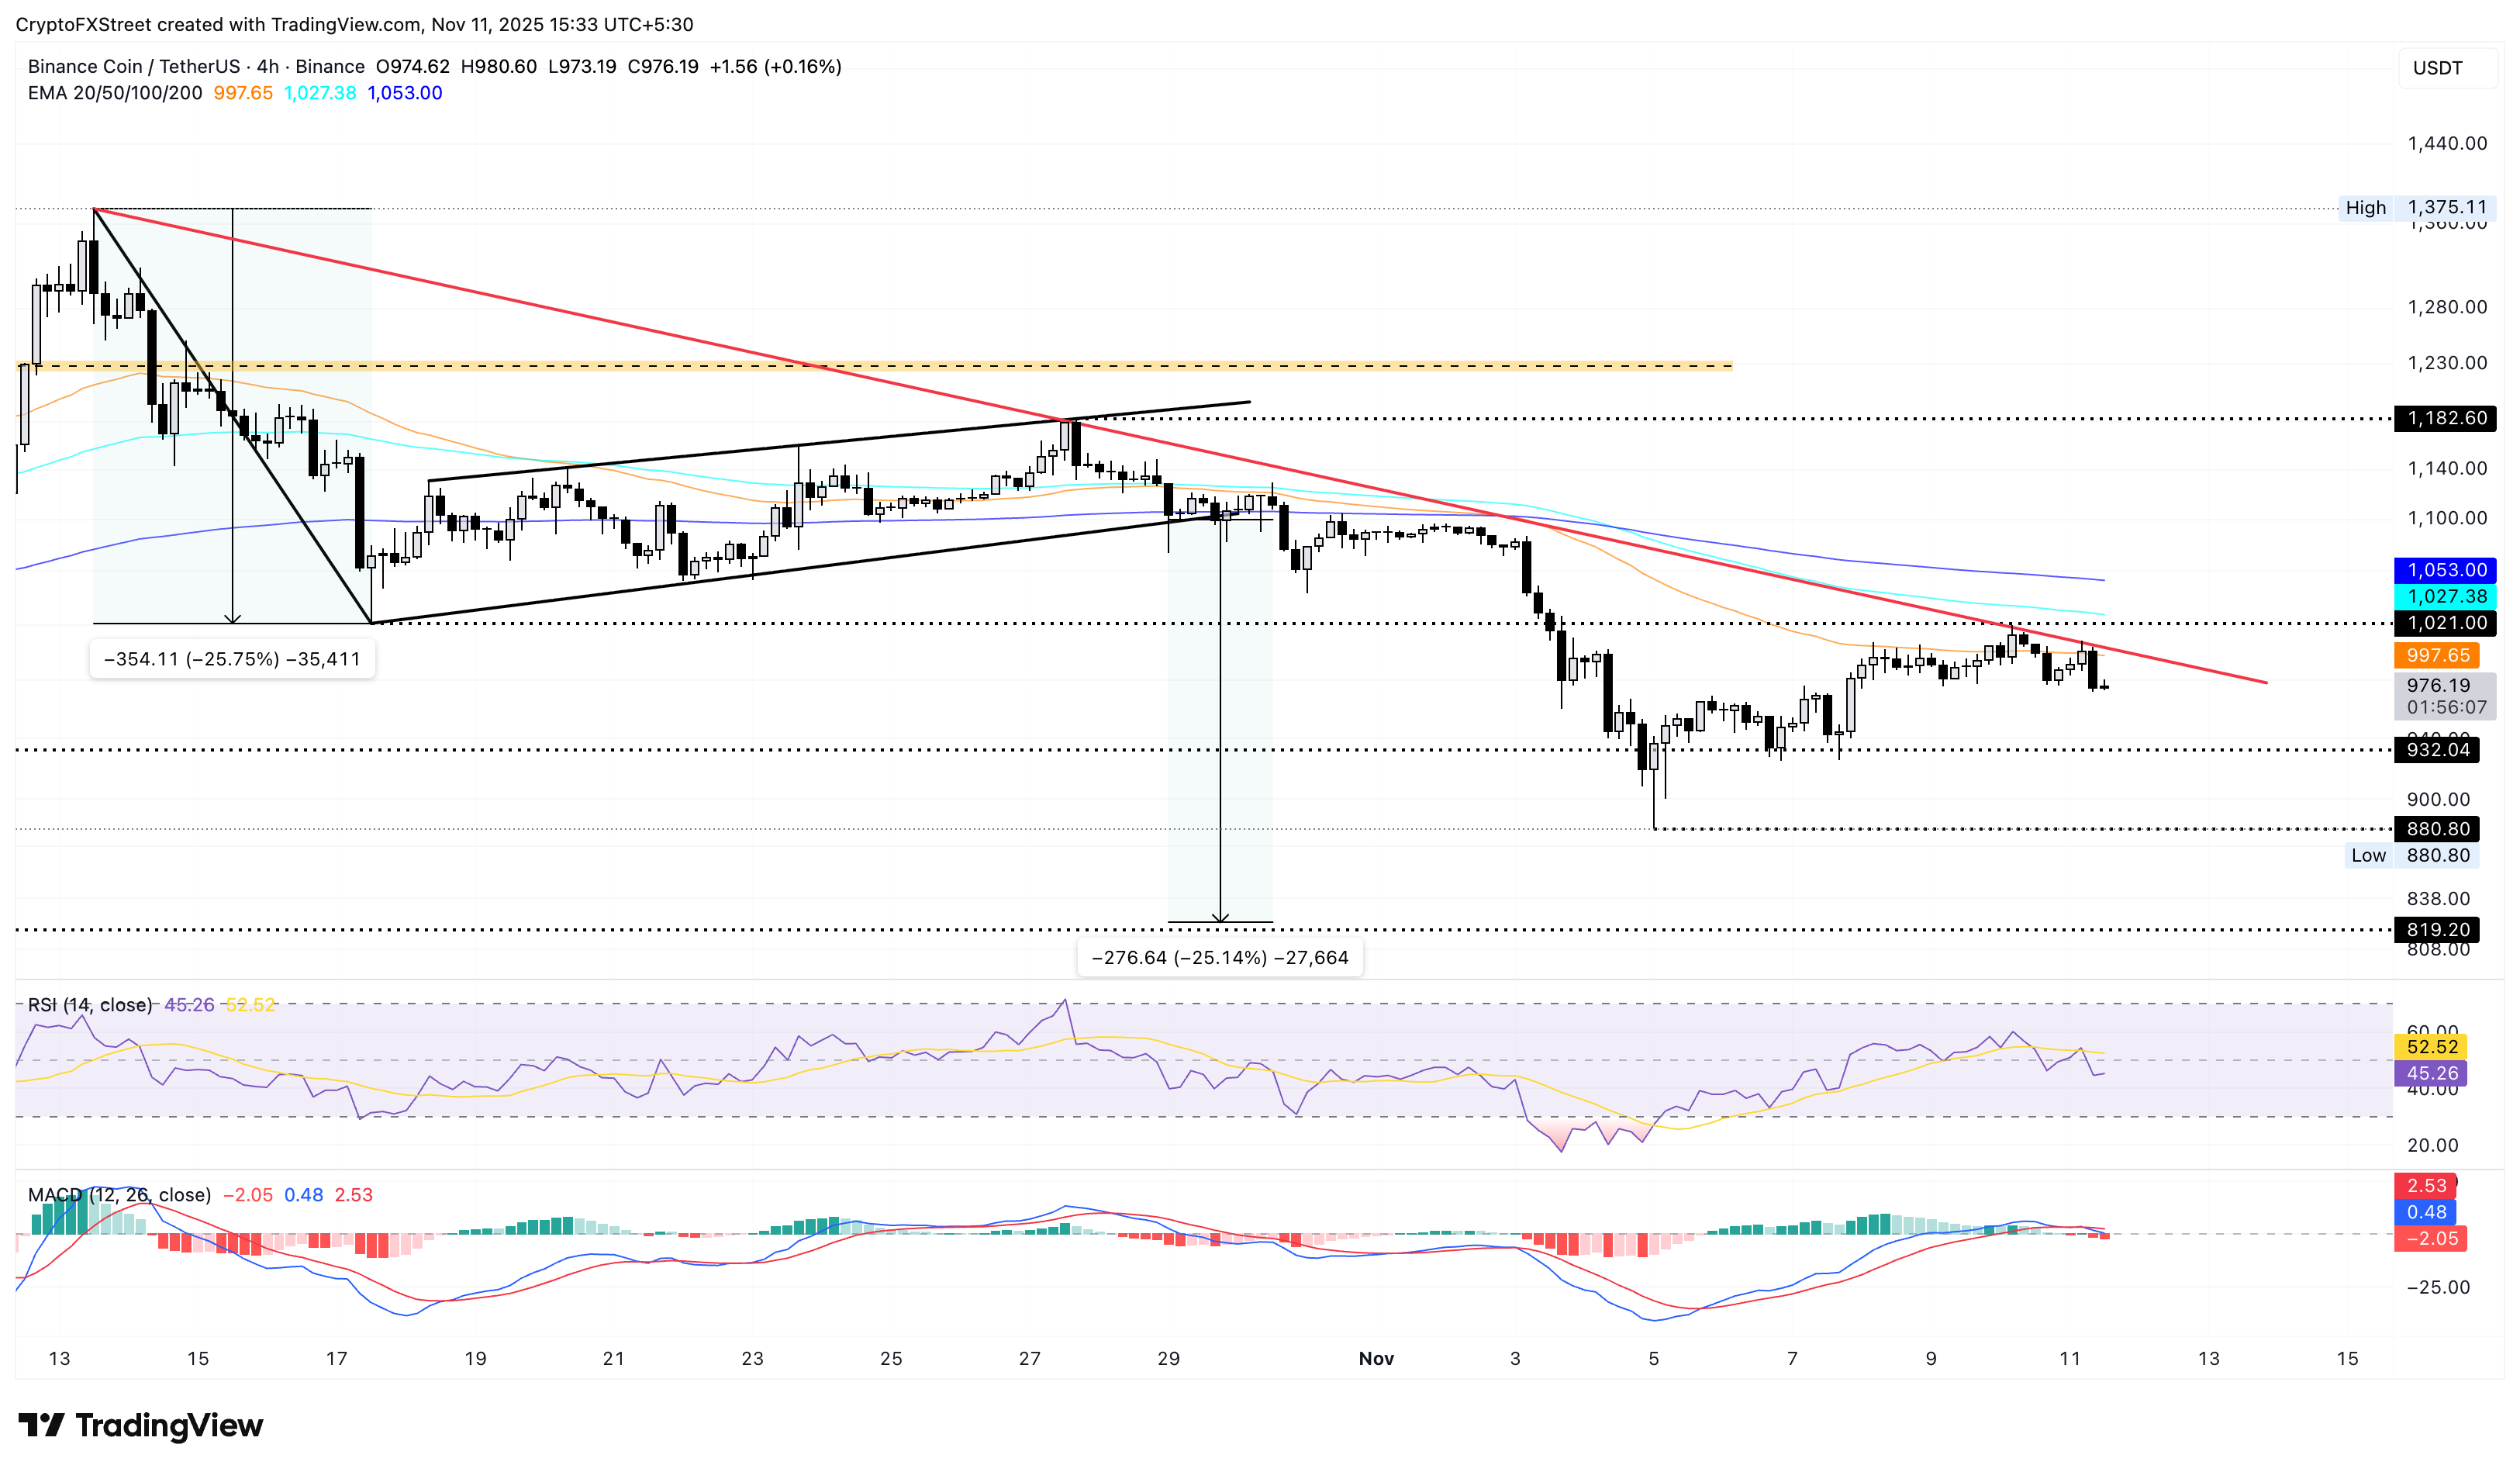
However, if BNB reclaims the $1,000 mark with a decisive close on the 4-hour chart, it would confirm the trendline breakout. In such a case, the breakout rally could target the 200-period Exponential Moving Average (EMA) at $1,053, followed by the $1,182 peak from October 27.
Related Articles
Amazon Stock Predictions for 2026 to 2030: Will They Exceed Expectations and Achieve Major Long-Term Goals?
TradingKey - As we head into 2026, many investors are questioning where Amazon (AMZN) fits into the technology world.
A Crash After a Surge: Why Silver Lost 40% in a Week?
TradingKey - Spot silver (XAGUSD) prices continue to decline. Silver plunged 20% on Thursday, breaking below $71 per ounce, with the sell-off intensifying on Friday as prices fell further below $64. Compared to the all-time high set on January 29, silver prices have retraced more than 40%, wiping out nearly all gains accumulated over the previous month.
Google Cloud Revenue Surges 48% in Q4 as CapEx Guidance Nearly Doubles: Why the 7.5% After-Hours Dip?
TradingKey - After the close on February 4 (ET), Google (GOOG, GOOGL) released stellar Q4 results: total revenue grew 18% year-over-year, hitting a new quarterly record after revenue first surpassed $100 billion in Q3. The primary highlight was Google Cloud, where Q4 revenue surged 48% year-over-yea
Is Bitcoin’s Four-Year Cycle Dead in 2026?
Is the Bitcoin 4-year cycle dead? After 2025 broke historical records with a red post-halving year, institutional analysts explore if the Bitcoin price has decoupled from the halving countdown. Analyze the impact of spot ETFs, global liquidity, and the roadmap to the 2028 halving in this 2026 market

