

Litecoin Price Forecast: LTC eyes breakout above $105 as bullish momentum builds

- Litecoin price hovers around $105 on Tuesday, approaching a key resistance level at $101.4.
- Rising trading volume, positive funding rates, and large wallet accumulation signal strengthening bullish sentiment.
- Technical indicators show upward momentum gaining traction, suggesting an upward trend ahead.
Litecoin (LTC) price is showing signs of renewed strength on Tuesday, trading near $105 as bullish momentum builds across the market. On-chain and derivatives data indicate growing investor confidence, with increasing trading volumes, positive funding rates, and accumulation by large holders. The technical outlook supports further gains as momentum indicators are gaining traction.
Litecoin’s on-chain and derivatives data suggest further gains
Santiment data indicate that the Litecoin ecosystem’s trading volume (the aggregate trading volume generated by all exchange applications on the chain) reached $2.03 billion on Sunday, the highest level since mid-October and stands at around $1.46 on Tuesday. This volume rise indicates a surge in traders’ interest and liquidity in Litecoin, boosting its bullish outlook.
 [08-1762832131386-1762832131398.19.13, 11 Nov, 2025].png)
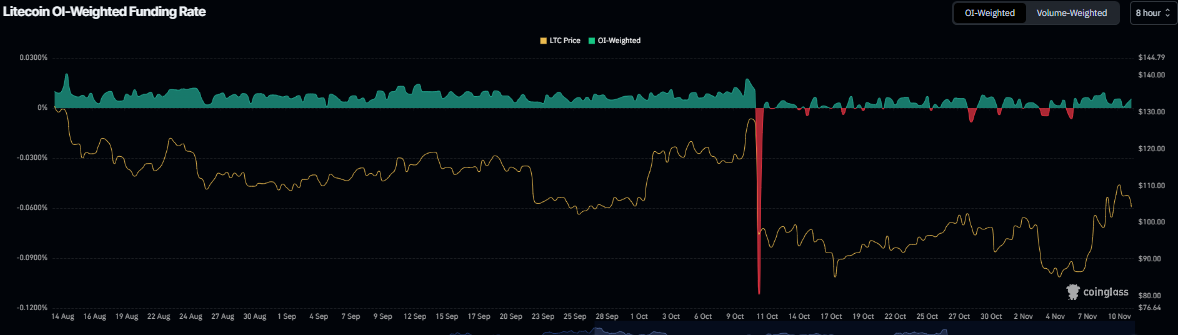
CoinGlass’s OI-Weighted Funding Rate data shows that the number of traders betting that the price of Litecoin will slide further is lower than that anticipating a price increase. The metric has flipped to a positive rate and currently reads 0.0055%, indicating that longs are paying shorts and suggesting bullish sentiment among traders.
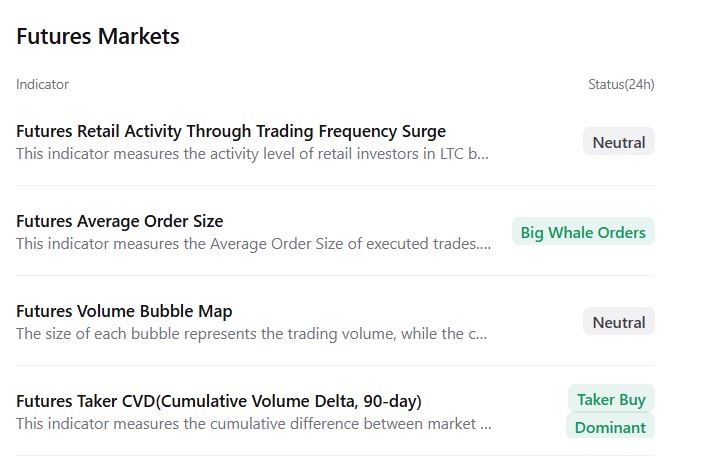
CryptoQuant futures market data suggest a positive outlook, as LTC shows large whale orders and buy dominance, signaling a potential recovery ahead.
Litecoin Price Forecast: LTC momentum indicators gaining traction
Litecoin price surged more than 10% last week, closing above key resistance levels at $96.30 and 50-day EMA at $101.45. At the time of writing on Tuesday, LTC hovers around $105.90, finding support around its 50-day EMA.
If the 50-day EMA at $101.45 continues to hold as support, it could extend the rally toward the October 6 high at $135.99.
The Relative Strength Index (RSI) on the daily chart reads 56, above the neutral level of 50, indicating bullish momentum gaining traction. The Moving Average Convergence Divergence (MACD) showed a bullish crossover last week, which remains intact, suggesting the continuation of an upward trend.
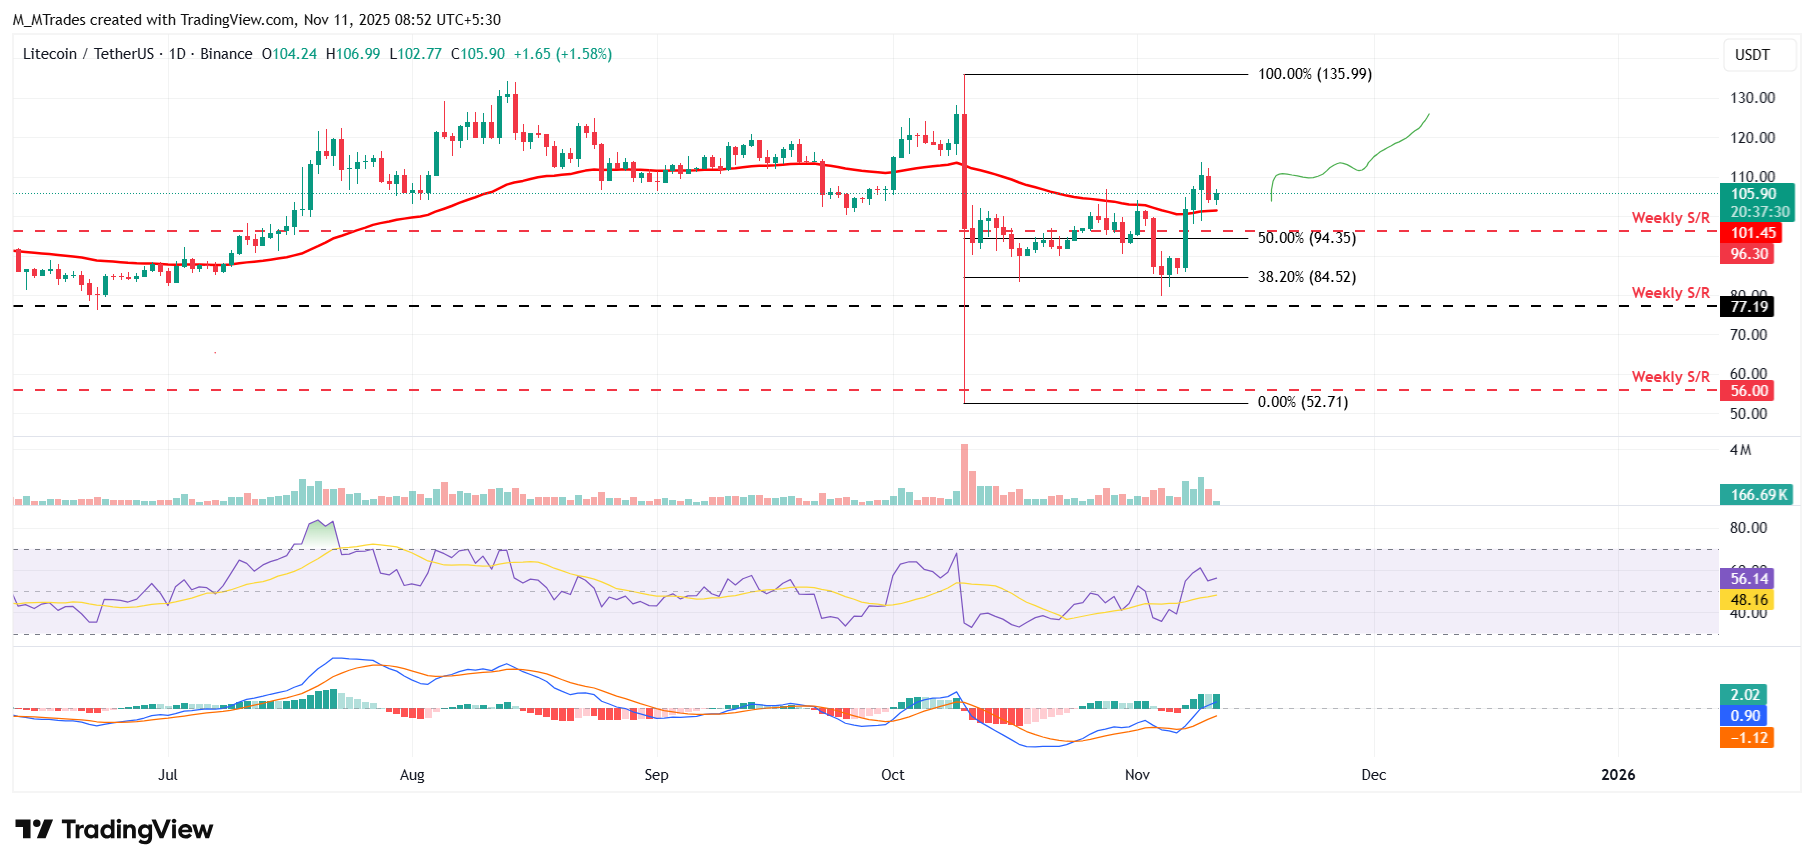
On the other hand, if LTC faces a correction and closes below the 50-day EMA at $101.45, it could extend the decline toward the weekly support at $96.30.
Related Articles
Amazon Stock Predictions for 2026 to 2030: Will They Exceed Expectations and Achieve Major Long-Term Goals?
TradingKey - As we head into 2026, many investors are questioning where Amazon (AMZN) fits into the technology world.
A Crash After a Surge: Why Silver Lost 40% in a Week?
TradingKey - Spot silver (XAGUSD) prices continue to decline. Silver plunged 20% on Thursday, breaking below $71 per ounce, with the sell-off intensifying on Friday as prices fell further below $64. Compared to the all-time high set on January 29, silver prices have retraced more than 40%, wiping out nearly all gains accumulated over the previous month.
Is Bitcoin’s Four-Year Cycle Dead in 2026?
Is the Bitcoin 4-year cycle dead? After 2025 broke historical records with a red post-halving year, institutional analysts explore if the Bitcoin price has decoupled from the halving countdown. Analyze the impact of spot ETFs, global liquidity, and the roadmap to the 2028 halving in this 2026 market
USD Dollar Trend Forecast: Dollar Index Falls Below 97.0 to 4-Year Low, Will the Dollar Continue To Fall or Bottom Out in 2026?
TradingKey - In January 2026, the US Dollar Index continued its downward trend from 2025, officially breaking below the key 97.0 level and reaching a low of 95.5, marking a nearly four-year low since February 2022.

