

Bitcoin Cash Price Forecast: BCH risks drop to $450 as bearish sentiment deepens

- Bitcoin Cash price hovers around $508 on Tuesday after being rejected by the previously broken trendline.
- On-chain and derivatives metrics point to a bearish outlook, with falling social dominance, declining open interest, and negative funding rates.
- Technical indicators suggest further downside potential, with bears eyeing the $450 support level.
Bitcoin Cash (BCH) price is hovering around $508 at the time of writing on Tuesday, after being rejected by the previously broken trendline. Weak on-chain and derivatives metrics, coupled with declining market sentiment, suggest a deeper correction as bears set their sights on the $450 support zone.
On-chain and derivatives data signal bearish momentum for Bitcoin Cash
Santiment’s Social Dominance metric for BCH highlights its bearish outlook. The index measures the share of BCH-related discussions across the cryptocurrency media. It has dropped from 0.76% on October 25 to 0.15% on Tuesday, its lowest level this year and the lowest since July 2023. This fall indicates waning investor interest and reduced community engagement around Bitcoin Cash.
 [08-1762226123269-1762226123270.27.49, 04 Nov, 2025].png)
BCH Social Dominance chart. Source: Santiment
On the derivatives side, Coinglass’s futures Open Interest for Bitcoin Cash drops to $148.18 million on Tuesday, compared to $200 million on October 4. This drop in OI, which has been falling since September, signals waning investor participation and reinforces a weakening market sentiment for the BCH.
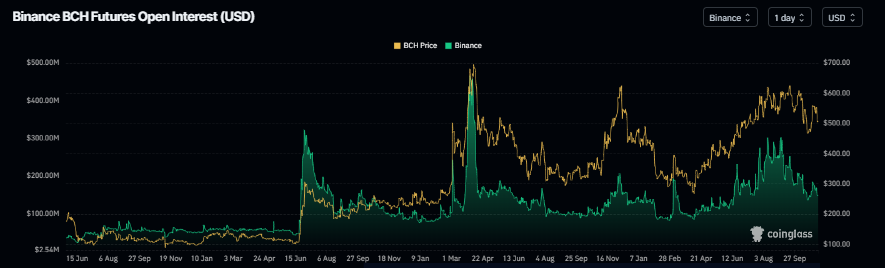
Bitcoin Cash open interest chart. Source: Coinglass
Coinglass’s OI-Weighted Funding Rate data shows that the number of traders betting that the price of BCH will slide further is higher than that anticipating a price increase. The metric flipped to a negative rate on Tuesday, to 0.0039%, indicating that shorts are paying longs. Historically, as shown in the chart below, when the funding rates have flipped from positive to negative, the BCH price has fallen sharply.
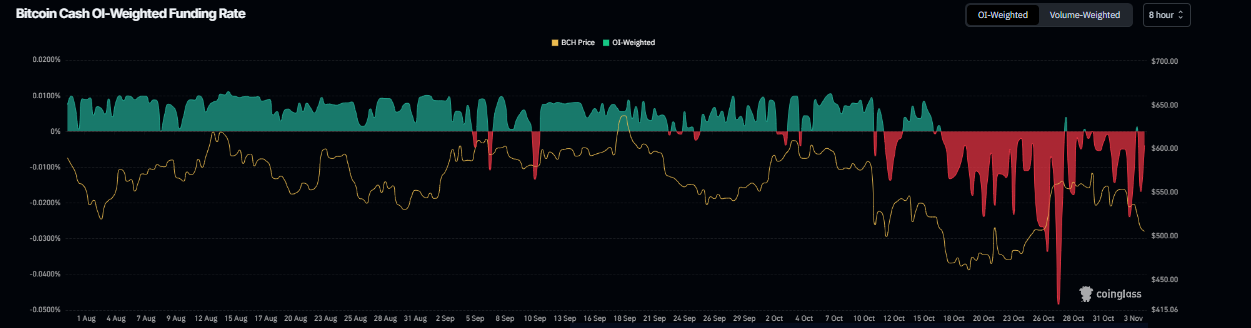
BCH funding rate chart. Source: Coinglass
Bitcoin Cash Price Forecast: BCH bears targeting a drop toward $450
Bitcoin Cash price faced rejection at the previously broken trendline last week and declined by 4%. This trendline roughly coincides with the 78.6% Fibonacci retracement level (drawn from the April low of $249.4 to the September high of $651) at $565.1, making this a key resistance zone. On Monday, BCH continued its correction, declining by more than 5%. At the time of writing on Tuesday, BCH hovers around $508.
If BCH closes below the 61.8% Fibonacci level at $497.6, it could extend the decline toward the next support level at $450.2.
The Relative Strength Index (RSI) on the daily chart reads 43, below the neutral level of 50, indicating bearish momentum gaining traction. The Moving Average Convergence Divergence (MACD) lines are also converging, with decreasing green histogram bars signaling fading bullish momentum.
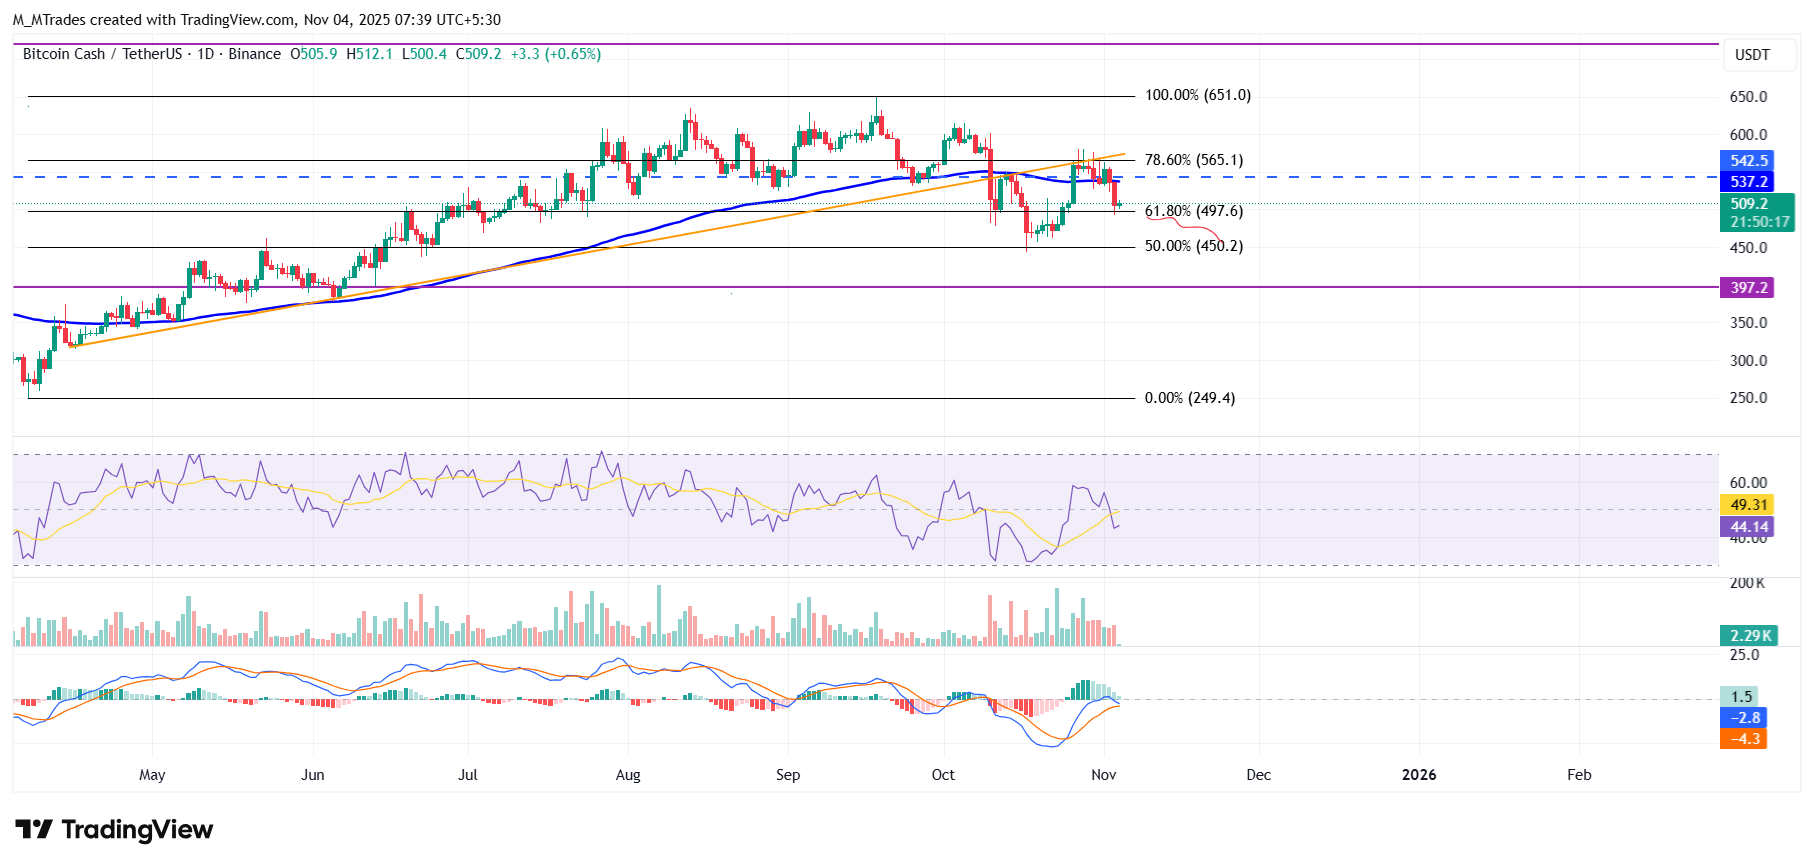
BCH/USDT daily chart
On the other hand, if BCH finds support around the $497.6 level and recovers, it could extend the recovery toward the 100-day EMA at $537.1.
Related Articles
Amazon Stock Predictions for 2026 to 2030: Will They Exceed Expectations and Achieve Major Long-Term Goals?
TradingKey - As we head into 2026, many investors are questioning where Amazon (AMZN) fits into the technology world.
A Crash After a Surge: Why Silver Lost 40% in a Week?
TradingKey - Spot silver (XAGUSD) prices continue to decline. Silver plunged 20% on Thursday, breaking below $71 per ounce, with the sell-off intensifying on Friday as prices fell further below $64. Compared to the all-time high set on January 29, silver prices have retraced more than 40%, wiping out nearly all gains accumulated over the previous month.
Is Bitcoin’s Four-Year Cycle Dead in 2026?
Is the Bitcoin 4-year cycle dead? After 2025 broke historical records with a red post-halving year, institutional analysts explore if the Bitcoin price has decoupled from the halving countdown. Analyze the impact of spot ETFs, global liquidity, and the roadmap to the 2028 halving in this 2026 market
USD Dollar Trend Forecast: Dollar Index Falls Below 97.0 to 4-Year Low, Will the Dollar Continue To Fall or Bottom Out in 2026?
TradingKey - In January 2026, the US Dollar Index continued its downward trend from 2025, officially breaking below the key 97.0 level and reaching a low of 95.5, marking a nearly four-year low since February 2022.

