Bitcoin Cash Price Forecast: BCH eyes breakout as futures data hint at bullish bias

- Bitcoin Cash price steadies around $560 on Thursday, approaching a key resistance zone.
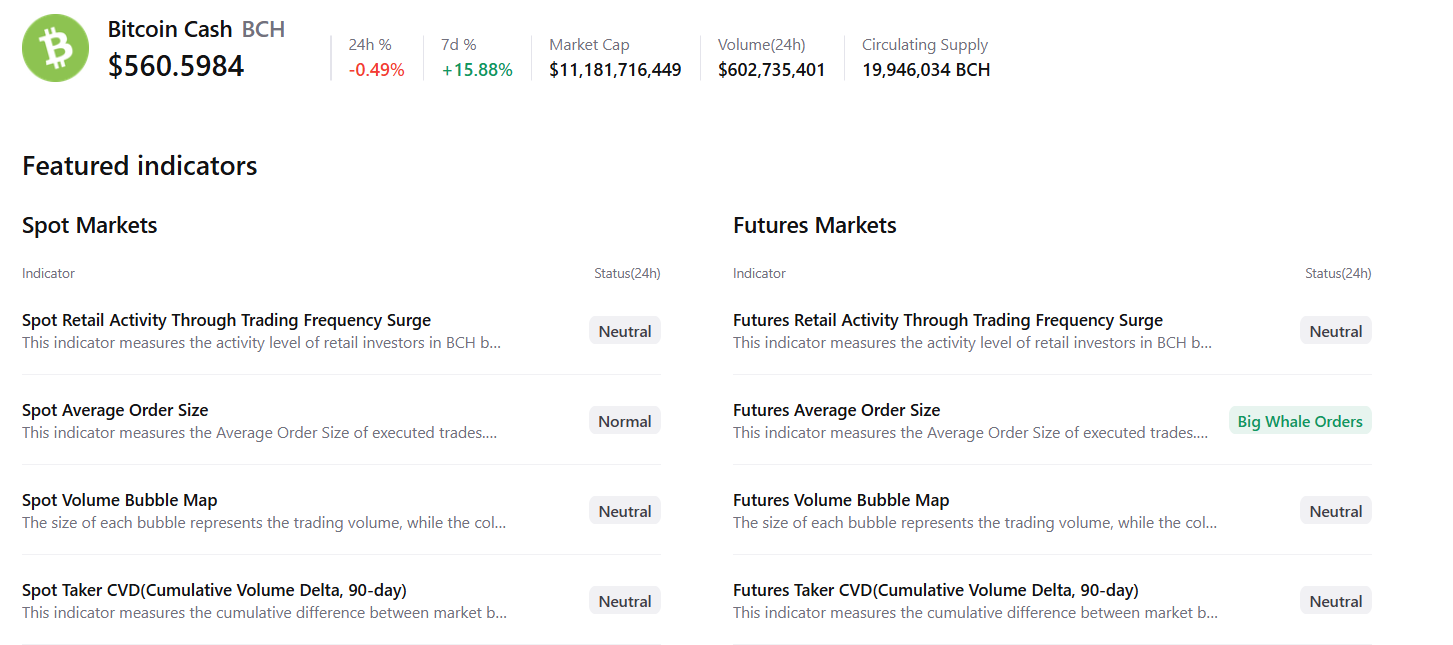
- On-chain data remains neutral, while the futures market shows a mild bullish tilt.
- The technical outlook suggests that a daily close above $565.1 could open the door to further upside momentum.
Bitcoin Cash (BCH) price steadies around $560 at the time of writing on Thursday, nearing its key resistance zone. While on-chain data remains neutral, slight bullish signals in the futures market indicate growing optimism among traders. On the technical side, a decisive close above $565.1 could confirm renewed upward momentum for BCH in the near term.
BCH’s show bullish bias on the futures market
CryptoQuant’s summary data supports a mildly bullish outlook for Bitcoin Cash, showing that while the spot market remains neutral, the futures market indicates rising whale activity, signaling a rally ahead.
On the derivatives side, Coinglass’s OI-Weighted Funding Rate data shows that the number of traders betting that the price of BCH will slide further is lower than that anticipating a price increase. The metric has flipped to a positive rate, standing at 0.0007% on Thursday, indicating that longs are paying shorts. Historically, as shown in the chart below, when the funding rates have flipped from negative to positive, BCH has rallied sharply.
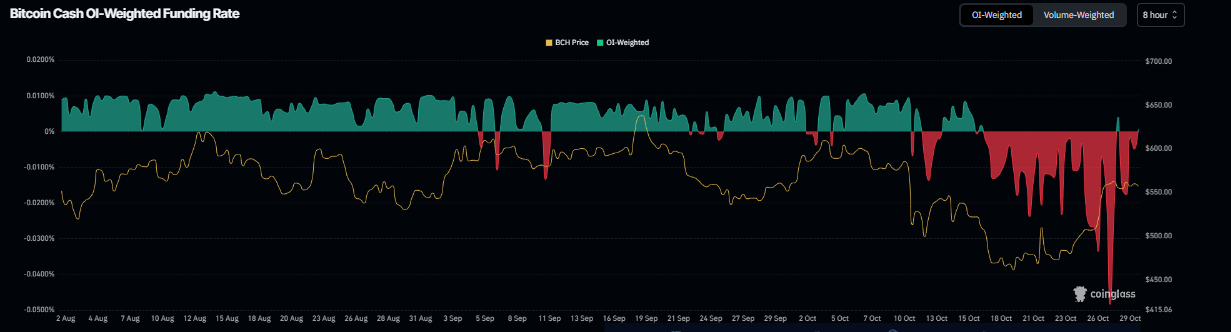
BCH funding rate chart. Source: Coinglass
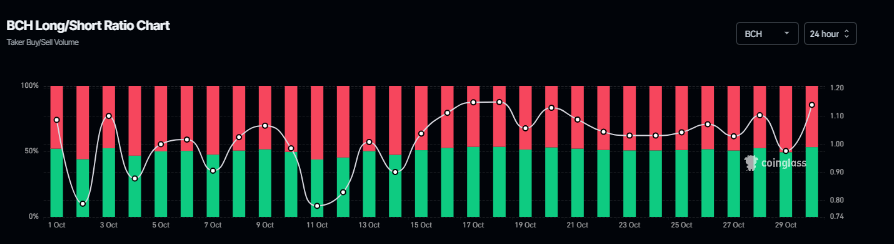
Coinglass’s long-to-short ratio for BCH reads 1.14 on Thursday, nearing the highest level over a month. The ratio above one suggests that more traders are betting on BCH’s price to rally.
Bitcoin Cash Price Forecast: BCH could rally if it closes above $565.1 mark
Bitcoin Cash price has been facing resistance around the 78.6% Fibonacci retracement level (drawn from the April low of $249.4 to the September high of $651) at $565.1 since Monday and has found support around the 50-day Exponential Moving Average (EMA) at $542.3. At the time of writing on Thursday, BCH trades slightly above the 78.6% resistance level.
If BCH closes above the $565.1 resistance level on a daily basis, it could extend the rally toward the September 18 high of $651.
The Relative Strength Index (RSI) on the daily chart reads 59, above the neutral level of 50, indicating bullish momentum gaining traction. Additionally, the Moving Average Convergence Divergence (MACD) showed a bullish crossover last week, providing a buy signal. Moreover, the rising green histogram bars above the neutral level support bullish momentum and suggest an upward trend.
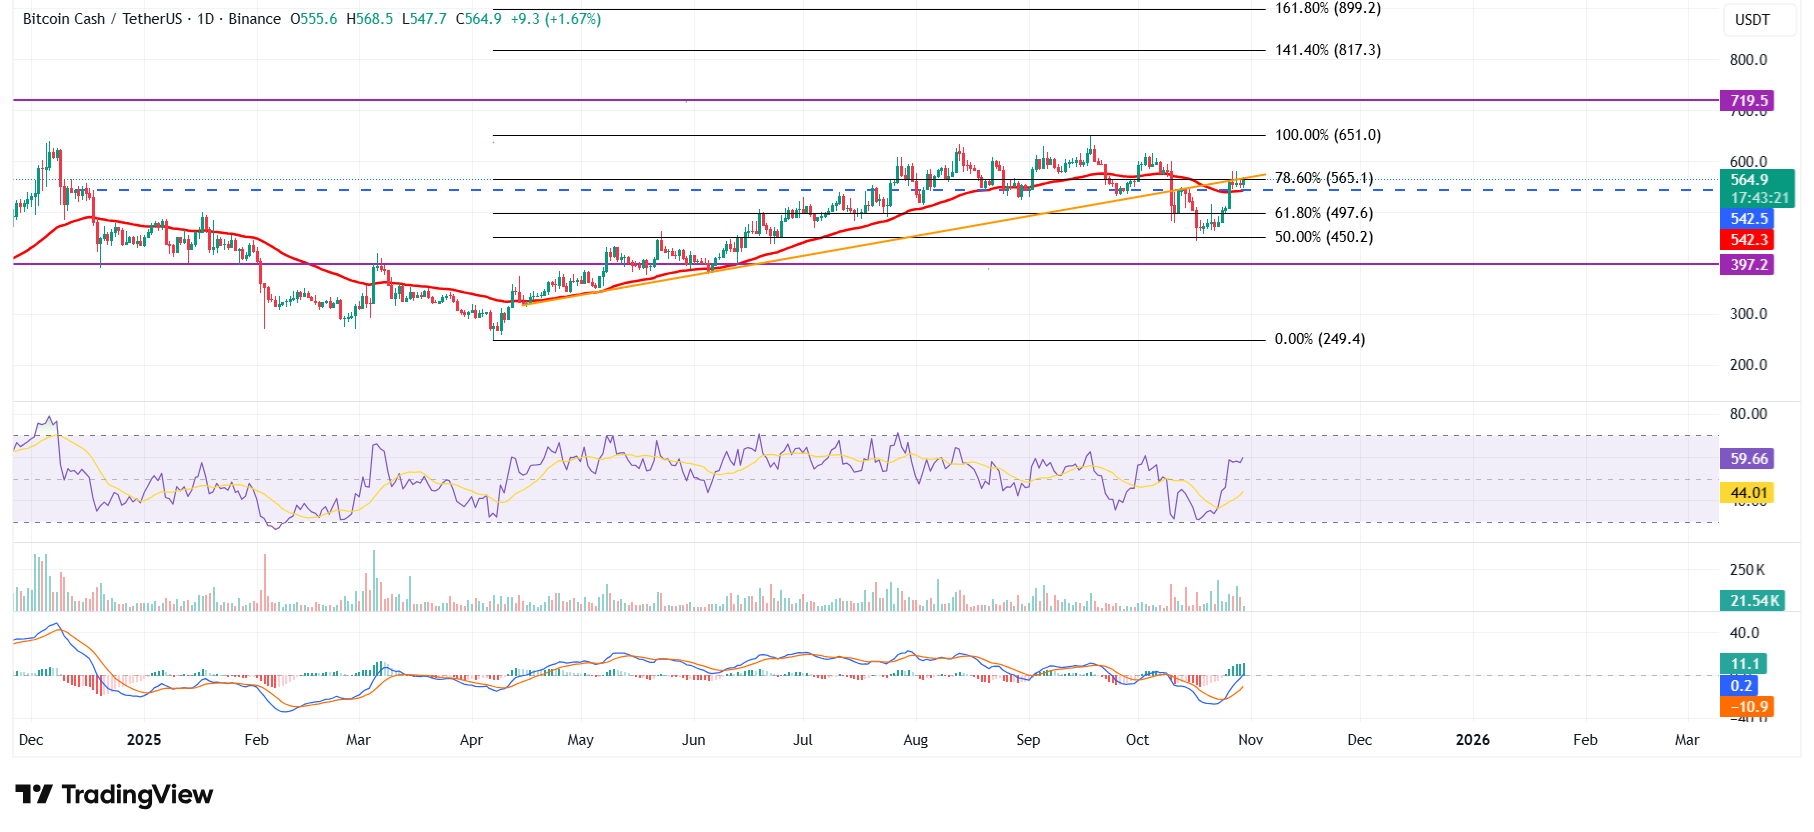
BCH/USDT daily chart
On the other hand, if BCH faces a correction, it could extend the decline toward the 50-day EMA at $542.3.
Related Articles
Amazon Stock Predictions for 2026 to 2030: Will They Exceed Expectations and Achieve Major Long-Term Goals?
TradingKey - As we head into 2026, many investors are questioning where Amazon (AMZN) fits into the technology world.
A Crash After a Surge: Why Silver Lost 40% in a Week?
TradingKey - Spot silver (XAGUSD) prices continue to decline. Silver plunged 20% on Thursday, breaking below $71 per ounce, with the sell-off intensifying on Friday as prices fell further below $64. Compared to the all-time high set on January 29, silver prices have retraced more than 40%, wiping out nearly all gains accumulated over the previous month.
Is Bitcoin’s Four-Year Cycle Dead in 2026?
Is the Bitcoin 4-year cycle dead? After 2025 broke historical records with a red post-halving year, institutional analysts explore if the Bitcoin price has decoupled from the halving countdown. Analyze the impact of spot ETFs, global liquidity, and the roadmap to the 2028 halving in this 2026 market
Disney Trend Forecast: Disney FY26 First Quarter Net Profit Falls 6% Stock Price Slumps 7.4% Can Stock Price Continue to Rise in 2026?
TradingKey - At the start of 2026, global entertainment giant Disney (DIS) faced a disappointing start to the year. Its Q1 FY2026 earnings report showed that revenue grew 5% year-on-year to $25.98 billion, seemingly achieving steady growth; however, net profit fell 6% year-on-year to $2.4 billion. N